
Большинство статей о научных исследованиях неотделимы от диаграмм, особенно диаграмм. Знакомство с некоторыми программами для рисования и отображение диаграмм в статьях и PPT является важным содержанием обучения научным исследованиям. Красивые статьи с картинками могут добавить много очков к вашей работе, Shengxinbaodian запускает серию руководств по R.Эффективное и практическое руководство ggplot2 (визуальный сценарий, инструменты, процедуры, сопоставление цветов)Объясните, как рисовать высококачественные изображения с помощью языка R. Позже, чтобы было удобнее использовать, команда Shengxinbaodian разработала онлайн-инструмент для рисования.www.ehbio.com/ImageGP, Поддерживает 14 общих графиков и частичный анализ ампликона, очень популярный, со средним ежедневным посещением 400 раз, в общей сложности сотнями тысяч посещений, охватывающим все континенты мира, и функции постоянно добавляются и улучшаются.
Многие знакомые на заднем плане говорили, что на рисование больше спроса, поэтому разобралсяGraphpadОдно из них — распространение знаний, второе — учиться на отличном программном обеспечении.Онлайн-рисунокВсе лучше и лучше.Graphpad, Origin и SigmaPlotЭто три программы для статистического картирования, обычно используемые в областях научных исследований. У них есть свои преимущества и недостатки, и их часто необходимо использовать вместе.
Сегодня я познакомлю вас с основами использования Graphpad.
Понять типы диаграмм Graphpad
Вот приветственный интерфейс Graphpad
ИзВставка 1Видно, что Graphpad Prism 6 предоставляет пользователям6 видовВыбор базовой статистической диаграммы;Вставка 2Есть пояснение к выбранному типу диаграммы, нажмитеLearn moreПросмотр официальных справочных документов;Вставка 3Вы можете выбрать небольшую категорию под определенный тип диаграммы;Вставка 4В офисе есть демонстрационный набор данных, который поможет новичкам начать работу.

graphpad_welcome.png
Описание шести типов статистических диаграмм и используемых статистических методов:
-
XY:
Введение: То есть система координат XY используется для определения положения точки. Если данные имеют несколько повторений, можно вычислить среднее значение и стандартное отклонение, а при рисовании можно вставить планки ошибок.
Статистические методы: Линейная регрессия, нелинейная регрессия, корреляционный анализ.
-
столбец: гистограмма
Введение: Есть только один индекс группировки, такой как группа лечения и контрольная группа.
Статистические методы: T-критерий для одной выборки, парный t-критерий, групповой t-критерий, тест на сумму рангов для одной выборки, тест на сумму рангов для двух независимых выборок, тест на сумму рангов для нескольких независимых выборок, односторонний дисперсионный анализ.
-
grouped: двумерная сгруппированная гистограмма
Введение: Есть несколько показателей группирования, например, статистика разницы между группой лечения и контрольной группой у пациентов мужского и женского пола.
Статистические методы: Двухфакторный дисперсионный анализ, двухвыборочный дисперсионный анализ с повторными измерениями.
-
непредвиденные обстоятельства: таблица непредвиденных обстоятельств
Введение: Он очень похож на сгруппированную комбинированную диаграмму, разница в том, что нет полосы ошибок, то есть потому, что нет повторяющегося значения измерения, один столбец — это одно значение.
Статистические методы: Тест хи-квадрат, точный тест Фишера.
-
выживаемость: график кривой выживаемости
Статистические методы: Сравнение одномерных кривых выживаемости.
-
Части от целого: отношение частей к целому, обычно представленное в виде круговой диаграммы.
Демонстрация построения сгруппированной гистограммы
Выберите здесьgroupedВторой готовый набор данных представлен ниже для демонстрации картографии. Щелкните сразу после выбораcreatОК.

graph_grouped.png
Основной интерфейс работы
После предыдущего шага мы вошли в основной интерфейс работы графической панели,

control_panel.png
Вставка 1Здесь представлены наши данные, каждая группа представляет три разные клеточные линии (клетки дикого типа, клеточная линия GPP5 и клеточная линия GPP7); каждая строка представляет различное лечение (сывороточное голодание и нормальная культура); каждая группа 5 параллельных повторов.
В экспериментальных данных отсутствуют значения, например A: Y4 в первой строке.
Вставка 2ГдеДерево каталогов
- Таблицы данных: нажмите, чтобы отобразить проанализированный набор данных;
- Информация: щелкните здесь, чтобы отобразить основную информацию о данных, и вы можете добавить некоторые замечания и описания;
- Результаты: отображение результатов биометрического анализа (будет обсуждено далее);
- Графики: после ввода данных щелкните этот значок, чтобы сначала создать статистический график, а затем слегка изменить его в соответствии с результатами статистического анализа;
- Макеты: макет нескольких диаграмм.
Выберите тип рисунка
После импорта данных нажмитеGraphsКартину можно нарисовать так:

Graph0.png
В этом интерфейсе вы можете изменить тип графика в соответствии с вашими потребностями. Новички должны осмелитьсяГрязный, Попробуйте сами разные варианты, вы можете узнать, какая функция у каждой части. (Попробуй научиться)
- Семейство графиков: измените тип графика, который представляет собой 6 типов, упомянутых в начале;
- Нанесите на график отдельные значения и составьте сводные данные: как следует из названия, первое отображает 5 параллельных значений каждой группы экспериментов на рисунке, а второе отображает среднее значение. Выберите подходящий способ рисования группировки;
- Чередующиеся полосы: полосы ошибок, щелкните раскрывающийся список График, добавьте полосы ошибок на график в соответствии с различным статистическим анализом, обычно выбирайте
Mean with SD。
Статистический анализ
Предварительный статистический график, сделанный выше, не показывает результаты статистического анализа, такие как различия между группами, поэтому как мы можем добавить*Чтобы показать разницу между группами?
В приветственном интерфейсеenter and plot error values already calculated elsewhereОпция, это означает, что вы можете импортировать извне результаты статистического анализа, выполненного в других местах. Вы хотите провести расчеты в других местах перед рисованием?
Незачем! Потому что статистический анализ можно проводить прямо на Graphpad! ! ! Хотя вы можете проводить анализ и в других местах, это делать не рекомендуется, и удобнее работать напрямую.
Сначала определите наши цели анализа:
1) Оценить, превышают ли различия между линиями клеток ожидания;
2) Оцените, превышает ли разница между обработками ожидаемую вероятность непредвиденных обстоятельств;
3) Оценить, соответствует ли разница между обработками для каждой клеточной линии;
4) Рассчитайте 95% доверительный интервал для разницы между клеточными линиями, обработанными разными способами.
Итак, нам нужноДвухфакторный дисперсионный анализ, НажмитеAnalyze, Выберите из списка сгруппированного анализаTwo-way ANOVAИ примите все параметры по умолчанию в диалоговом окне. Гуманность Graphpad заключается в том, что он автоматически распознает текущую структуру анализируемых данных и показывает пользователям лучшие варианты анализа по умолчанию.

analyze.png
Последующий конкретный анализ требует определенных статистических знаний. Не бойтесь попробовать. Вы обнаружите, что, когда вы нажимаете на различные параметры, значки также изменяются, что очень удобно для пользователей.
1) Первая часть: экспериментальный план. Вначале было упомянуто, что этот набор данных не является парным, поэтому выберите первый.
2) Вторая часть: несколько вариантов сравнения, то есть если вам нужно соотношение по горизонтали, вертикали или диагонали;
3) Часть 3. Выберите некоторые параметры для статистического анализа.


После настройки всего вышеперечисленного нажмитеOK, Результат анализа будет отображаться в главном рабочем интерфейсе и сохранен слева.Дерево каталоговвнизResultsПапка.

analyze_results.png

analyze_results1.png
Улучшение и улучшение статистического графика
1. Введение в панель инструментов редактирования графики

tools.png
1) Первая часть: модуль работы с документом, аналогичный офисному, например, открытие, создание, сохранение, копирование и вставка и т.д .;
2) Вторая часть: анализ данных, то есть статистический анализ исходных данных, продемонстрированный ранее;
3) Третья часть: редактирование графики, эта часть является сутью программного обеспечения. Редактировать и изменять графику, такую как тип графики, оси координат, полосы ошибок, размер графики, цвет и т. Д .;
4) Четвертая часть: редактирование текста, вы можете рисовать линии и добавлять текст на статистический график;
5) Часть 5: графический вывод, вы можете экспортировать, распечатать или вывести законченную графику в word / PPT.
2. Согласно результатам предыдущего статистического анализа, используйте инструменты редактирования текста, чтобы добавить на статистический график признаки различий между группами.
1) рисовать: можно вставлять линии разной формы;
2) писать: редактировать текст, вставлять формулу и т. д .;
3) Дважды щелкните любой элемент в графике, чтобы изменить форму, размер, толщину и т. д. текста, линий и т. д.

draw.png
3. Регулировка координатной оси
Нажмите наChangeсреднийВторой значок, Или на картинкеДважды щелкните по осиВызвать инструмент настройки координат;
Общие настройки оси координат и настройки оси X, см. Диаграмму, обычно не вносят слишком много изменений;

format01.png
Сосредоточьтесь на объяснении, как установить ось Y и сделатьУсеченный граф, Это общая проблема статистического картирования.
Предыдущие данные не сильно отличаются и не подходят для демонстрации, поэтому также создается гистограмма. Значение столбца слева слишком велико, значение столбца справа слишком мало, а столбец справа почти исчез, что делает график очень непоследовательным. ДелатьУсеченный графЭту проблему можно хорошо решить.

formatY0.png
1) Нажмите в настройках координатLeft Y axis(Обычно для рисования по умолчанию создается только левая ось Y);
2)Gaps and DirectionвыбиратьTwo segments, То есть ось Y разбита на две части (по фактическим данным вы также можете разбить ось Y на 3 части);
3) ВSegmentУстановите параметры (Rang) для оси Y нижней части (Bottom) и верхней части (Top) соответственно;
4) Затем вRegularly spaced ticksвнизMajor ticks intervalУстановите метку значения оси Y на место;
длина: 50%, половина длины верхней и нижней частей;
минимум: минимальное значение нижнего сегмента равно 0, а минимальное значение верхнего сегмента — 150;
максимум: максимальное значение нижнего сегмента — 10, максимальное значение верхнего сегмента — 200;
Основные отметки: размер каждой ячейки в нижнем разделе равен 2, а размер каждой ячейки в верхнем разделе равен 10.
Таким образом, средняя часть оси Y 10–150 обрезается, и вся картина выглядит намного лучше.
4. Модификация цвета
Нажмите наChangeсреднийПоследний значок, Или на картинкеДважды щелкните столбецВызвать панель инструментов для настройки параметров;

change.png
Основная операция использования графической панели для построения статистических графиков, вероятно, изложена выше.Нетрудно освоить использование инструмента, просто попробуйте его еще раз. Сложность заключается в статистических знаниях, стоящих за этим, как выбрать подходящий метод статистического анализа для ваших данных? После того, как вы освоите, к каким структурам данных применимы различные методы анализа, вы можете делать выводы друг из друга и проводить соответствующий анализ данных различных экспериментальных планов.
Статистика и графики R
- Похвалите вас в R за усердную работу и наградите CheatShet
- Электронные книги других людей, ваши электронные книги, все в резерве
- Среда ввода языка R Rstudio
- Рисование тепловой карты на языке R (тепловая карта)
- Основные понятия языка R и матричные операции
- Тепловая карта языка R упрощена
- Улучшение языка R и тепловой карты
- Рисование линейного графика на языке R
- Одношаговый метод R language-line graph
- График языковой рамки R (график скрипки, график джиттера, график разброса по площади)
- Одношаговый метод построения графика в языке R
- R язык-карта вулкана
- Пузырьковая диаграмма анализа обогащения языка R
- Рисунок графика разброса на языке R
- Диаграмма языка R-Венна
- Гистограмма языка R
- Настройки языка и графики R Китайский и английский шрифты
- Непараметрический анализ выживаемости на языке R
- Схема логотипа seq на языке R
- Анализ WGCNA, простой и всеобъемлющий последний учебник
- Анализ основных компонентов PCA в одной статье
- Обогащающий анализ DotPlot может служить
- Кластерный анализ коэкспрессии генов и визуализация
- 1010 методов рисования тепловой карты в R
- Все еще используете PCA для уменьшения размерности? Быстро изучите любимый алгоритм Дэниела t-SNE с кодом Python / R
- Функция для сбора всех табличных данных авторитетной базы данных метаболомики HMDB
- Доработка и набор картинок
- network3D: Интерактивная диаграмма Санки
- network3D интерактивное создание сети
- Инструмент для онлайн-рисования логотипов seq-Weblogo
- Руководство по получению и сборке иллюстративного материала биологического ИИ
- Эффективное и практическое руководство ggplot2 (визуальный сценарий, инструменты, процедуры, сопоставление цветов)
- Примечания к исследованию магии пакета R для обработки изображений
- Предварительное исследование кластерного анализа экспрессии гена SOM
- Используйте gganimate для визуализации глобального развития R-Ladies (организация сообщества R по гендерному разнообразию)
- Нарисуйте фосфолипидный бислой за одну минуту: введение AI на основе нуля и базовый графический рисунок
GraphPad Prism Crack + Serial Number Full Version (Win/Mac)
GraphPad Prism 10.2.1 Crack is a powerful statistical and scientific graphing program that provides data organization, understandable statistics, complete crew fitting, and scientific graphing. You can present your scientific study in a beautiful graphic with this software. All research or scientific inquiry types can use the app to analyze, plot, and present data. GraphPad Prism has a lower-level portfolio button for visual perspective. These tables facilitate the understanding of visual information.

In addition, it helps you to make suitable analyses for your research. With this program, you can perform spreadsheet operations in a planned manner. Also, it is commonly used by both undergraduate and graduate students. It also includes eight different types of desktops. These tables have different variants, nested, groupable, and columns. In addition, GraphPad Prism Full Cracked allows you to share your work quickly. In addition, technology has applications outside the realm of science. Also, look at the DBeaver 23.2.3 Crack
GraphPad Prism Crack 2024 License Key Here
The primary role of this tool is calculation in mathematics. Also, this tool supports statistical testing of the user. Also, this tool has an error meter that shows your errors. This product also includes an error bar to display error information. It has all the tools you need to keep a record of your data. GraphPad Prism Serial Key can be analyzed using an extensive library. Our comprehensive collection includes T-tests, nonlinear regression, one-way, two-way, and three-way ANOVA, emergency schedule analysis, non-parametric comparison, and survival analysis.
The latest version of this software can fit a curve, draw a turn on the graph, display a table of function parameters and results, and interpolate unknown values. You get a vibrant environment, meaning that the results are immediately updated whatever changes you make. Go beyond the ordinary with the help of an online GraphPad Prism Torrent—access thousands of pages of online pricing guides at virtually every step of the way. You can better understand why you should do specialized analysis and how to interpret your results using self-learning datasets. You also use the Soda PDF Latest Version Crack.
Creating a template, family copy, or graphic cloning can quickly replicate your work and save installation time. Instead of confusing your tools, focus on your data story. GraphPad Prism License Key makes it easy to create the graph you want. Ready to offer a variety of analyses, scientific investigations, sketches, and scientific files. You can use a nonlinear freehand application to evaluate the regression or research unit. To add tabular information, use a master key element. Check on, https://www.sportakvimi.net/galatasarayda-oncelik-kaleci-transferi-sergio-rico-gundemde/.

Key Features of GraphPad Prism:
- You can fully design your charts with this app.
- It can also change all elements of the graph.
- Without programming, this software can automate your work.
- In addition, GraphPad Prism Activation Code helps in calculating the area below the curve.
- Many regular tests and comparison tests are available.
- You can work with other researchers with this tool.
- In addition, it allows you to export high-quality graphics with one click.
- This program can change graphs in an unlimited number of ways.
- Calculate average, SD, SEM, CI, CV, quarter, standard, and.
- Graphs are processed with imaging software using correlation and linear regression.
- Analytical automation without coding is also suggested.
- Use image-editing software to change the graphics.
- Lots of options for nonlinear regression.
- There is no obligation to code it.
- It runs spreadsheets and programs.
First, select a long equation from the list of equations. In addition, it will automatically fit the table and render the result in tabular format. It contains elements of both scientific spreadsheets and visual applications. In addition, GraphPad Prism 10.2.1 Serial Number helps you to make the proper analysis for your research. Both researchers and science students often use it to review their data. Data can be estimated and displayed graphically.
What’s New in GraphPad Prism 10.2.1?
- Resolved an issue where data exported in CSV file format using the “wow” script command was separated by commas instead of space-delimited (win).
- Fixed a bug in macOS that caused gaps between adjacent bars on charts, even when it set the gap option to 0%.
- The problem with macOS 12 Monterey, which will crash when trying to finish an auto-save project, has been fixed with the latest version 9.4.0.673 crack.
- The “QC Chart” chart is now the left Y-axis title in the right place in the portfolio file.
- Also, GraphPad Prism Activation Key works better on Mac now when copying and pasting multiline datasets.
- Fixed command to email all charts and layouts as PDF (for Mac).
- Ctrl + 0 is a 100% zoom keyboard shortcut recently adopted in Windows.
- A new option for natural log (Ln) access scaling is available (Prisma already supports log10 and log2 axes)
- Introduced the option to compare graph pairs to add a prefix to numeric P-values.
- Introduce new controls that allow you to specify the size of the star symbol and the text size.
- Many changes have been noticed in the Pair Comparison Format dialog box.
- The Chinese text was added to the “License Verification Error” message.
- It applied P-value limits for pair-by-pair comparisons to the default set of “default values” (on Mac).
Related Software: Auslogics BoostSpeed Crack
GraphPad Prism Serial Key 2024:
LYQB7-TCWDZ-SY57R-DUS7E-TSGRO

YCRVS-YUZXS-IYT78-UZHUX-YTRAW

OGA9O-SEIDN-S79YR-9AXUS-CTYEA

SNDFY-UTS9Z-JXWCF-RYU9S-DFYCU

JSWDT-9ISUQ-ECX5R-UMNSY-5RIAS
System Requirements:
- Windows Vista, 10, 8, 7, 32-bit, and 64-bit versions are compatible with Prism.
- In addition, it runs macOS X 10.9 and later.
- Requires at least 2 GB RAM.
- Also, you need 80 MB on Mac and 60 MB on Windows.
- 800 x 540 pixels minimum screen resolution.
- Also, an internet connection is required to activate the license.
How to Crack?
- Download GraphPad Prism Crack 2024
- Extract and install the trial version
- Run the Crack or patch and get an activation
- Reboot the system and enjoy the full version
GraphPad Prism Review:
Thanks to the user-friendly and sophisticated interface that comes with this application, everyone can work efficiently. It allows you to duplicate your work with one click. With its unique technology, you can work automatically without knowing any computer programming language. Both Windows and Mac users can use this software. GraphPad Prism Free Download takes care of everything else. All you have to do is choose the equation. While others can easily follow your work at every step, your discoveries are more precise, and your joint efforts are more effective.
A capable statistical and scientific 2D graphing program is this app. Any sort of research, including scientific research, can use the program, including the analysis, mapping, and presentation of scientific data. This software facilitates nonlinear regression, curve fitting, and interpolation of unknown values. GraphPad Prism Crack Mac offers scientific mapping and spreadsheet skills. Analyses can be carried out using this application’s extensive library. With its incredible technology, you may work automatically without knowing any computer programming languages.
GraphPad Prism License Key For Mac:
LUYT6-REDSX-DCVBH-JKIUY-6T5RE

DFGVH-JKOIY-6FTRC-DYXHJ-KASD9

F86TR-CYHDX-JD9F6-7DTHC-YHDXJ

KSZ9I-DF6HT-XDHJK-ZSDLF-6HDYH

XDJXK-DSIXD-U65TR-HGKS9-D65TR
GraphPad Prism Key 2024:
JYHUF-DZKJS-OIDFU-GYFDH-DSJKI

D9FD8-UYGHD-FKSFD-IUYHI-SKJOD

UHYFD-NJIDU-FD8Y7-HDCDK-JXCIO

9GFU8-7YCDO-IPIMF-9UGYH-UXJDK

IOP98-DFUGY-HDUJK-SPOIF-D9GU8
DOWNLOAD NOW

Table of Contents
GraphPad Prism 2023 Crack + Full Torrent Download [Windows/Mac]
GraphPad Prism 10.0.0 Crack download free is the favored interpretation and graphing solution software. It helps you to simply and quickly graph and perform your scientific research. This software is more powerful than other scientific graphing solutions. And is also more powerful than other spreadsheets. Furthermore, it assists you in creating your scientific data efficiently. How this software is more reliable? This interesting application has both features of graphing programs and spreadsheets. And of course, this is true.
The 2D graphic system of this program is excellent. The program will display accurate and reliable results. GraphPad Prism 2023 Serial Number full download has eight types of tables that work with this program. The eight tables are XY, Column, Board, Strength, Life, All Things, Changes, etc.
The GraphPad Prism 2023 Crack computer has a small button to display images. These tables will help you create a white dough with detailed details without any problems. Also, GraphPad Prism Full Cracked is easy to monitor, enter data, and get an amazing graph. Also, it will lead you to amazing infographics and quick ways to share your work.
GraphPad Prism 2023 Crack With Torrent Full Download
Prism 10.0.0 with Torrent 2023 download program is not just for organizations or scientific researchers. But it’s good for everyone, in small or small groups. There is a large library to download the application. The main library also includes T-tests, static tests, one-, two-, three- and contingency tables, non-parametric comparisons, survival distribution, and much more. This makes it easy to plot curves that wouldn’t be possible on other digital computers. All you have to do is set the boundaries and the whole system
Displays movements, display symbols on graphs, tables of items, and work sections, and assigns undefined points. No number is required. GraphPad Prism Cracked latest will give you a better place where your changes will be updated in real time.
In short, there are no programs. GraphPad Prism 2023 Crack comes with a clear and friendly interface. So that everyone can operate easily. Your works can be accessed and clicked once. The fee requirement is an important part of the program. This will allow you to finish in seconds. You can download the new Helicon Focus Crack 2023.
Supreme Key Features:
- The analysis provides an overview of the checklist.
- GraphPad Prism is fully cracked and includes the ability to find error bars.
- It also provides non-linear regression.
- In addition, it has the option to copy data.
- This application also offers endless possibilities to customize your charts.
- Additionally, it allows you to export quality charts with one click.
- This software can automate your work without programming.
- Furthermore, no coding is to work with it.
- Helps to create graphic and spreadsheet programs.
- This application allows you to collaborate with other scientists.
- In addition, it helps to measure the area under the curve.
- This software helps in obtaining the characteristic curve of the receiver operator.
What’s New in GraphPad Prism Cracked?
- The GraphPad Prism 10.0 Cracked new version has included improvements in graphs and layouts that causes error in sending to MS PowerPoint (or Apple Keynote Mac).
- It has fixed multiple crises with macOS 12 Monterey.
- Solves the problem that the Prism T3 comparative test misinterpreted the alpha / 2 period on family intelligence (more here).
- Settled the problem in which it was unbelievable to determine definite variables in Graphs tabs of the Cox degeneration research.
- If the event change is significant and the realistic “think about other features” method is set to “none”, the “predictable” results of the Cox log analysis appear to be incorrect (not misleading).
- After placing a blank specific paragraph in the reference table, the Cox review section resolves the issue of residuals and missing sections from selected sections from the Graph tabs.
- Fixed an issue where constructions could not be identified if there was a space in the table based on the data in the “Graph” section of the Cox version analysis sections.
- After creating the results in the table and a few pages in the prism, Cox points out the problem that the analysis results do not show LML changes in the download results.
- It now also provides searchable analyses in the Analyze Data dialog in a more active way.
- Introduces the latest graphs with enhanced snapping action of axis titles.
- Graph Portfolio with innovative color schemes and additional repairs
- Now supported with Windows 11.
- Resolved X where the final X values in the source spreadsheet lose the Y value. X values disappear unexpectedly in generalization results.
- Issues addressed where plots with nonlinear regression curves with a specified X range do not show points in source data outside the specified X range.
- The new version also has bug fixes so far, providing a unique look (x).
- You can quickly create a logistic curve and get the most important results from your analysis.
- Toxicity studies are commonly found when examining the effect of new drug/composition concentrations.
- Fixed the point that the KI value is missing in the result after nonlinear resistance using the single-site competition (classical equation) model.
- Also, many new features have been in the new version, all dose-response equations now include versions such as x concentration and log (concentration) x.
- Includes new options for Natural Logarithm (LN) axis scale (Prism is already allowed in Log 10 and Log 2 axes).
- In addition, it can add multiple vaccines at once.
- Improved the functionality of copied and pasted datasets for Mac, with a large number of rows.
Other Latest Items:
- Are multiple comparisons worth noting? “Solve the problem., SD / SEM / CV, n if entered as source
- Adds the capability to modify the color or point type of specific data points.
- This version includes a modified version of its icon.
- There have also been some improvements in its efficiency and speed.
- In addition, several major bugs have been fixed in this version
How to get GraphPad Prism for free?
You can get it free by signing up for a trial version. Further, you can get its free version from our site by clicking the download button.
How much does GraphPad Prism cost?
Its price for the premium version is reasonable starting from $168 to 250$.
Why use GraphPad Prism?
You can use it for scientific graphs, fitting curves including logical statistics, and data organization. Prism will enable basic tests used by laboratory and clinical researchers.
GraphPad Prism 2023 Serial Number
- 75EDGT-REW4ED-FYY8TD-53Q2HD-GY
- WY98YG-F76WAW-ETT0OJ-UGYDE2-Q2
- 2WYYUO-JUYF5R-ERWE4S-EW76TY-TR
- EEWQW5-6T8UY9-IOPOI9-NHF65E-DT
- FRTTYR-E45GEU-WDY74Y-R6WEDG-O9
- 87TFW4-FRY66U-JOUOH5-ER2WER-T7
- Y89IIT-4F7G6F-G7DSF4-SCV9NX-3S
- 76CUET-REUTG6-RWIR7Y-GWEYTY-EY
- F98UYN-VWEU6R-VTWEVR-TYW6E5-TR
- I7W3Y4-ITM94Y-TW8YT9-OW6T7Y-W3
- I8TYOE-VIRUCD-RO9D78-RUGIDR-78
This latest Full Cracked version has characteristics of accurate scientific graphing applications and spreadsheets. Further, it supports you to make the best review for your research. The user can also make spreadsheet assignments with this software simply. Furthermore, it can automate your application work without programming.
Sample Image:
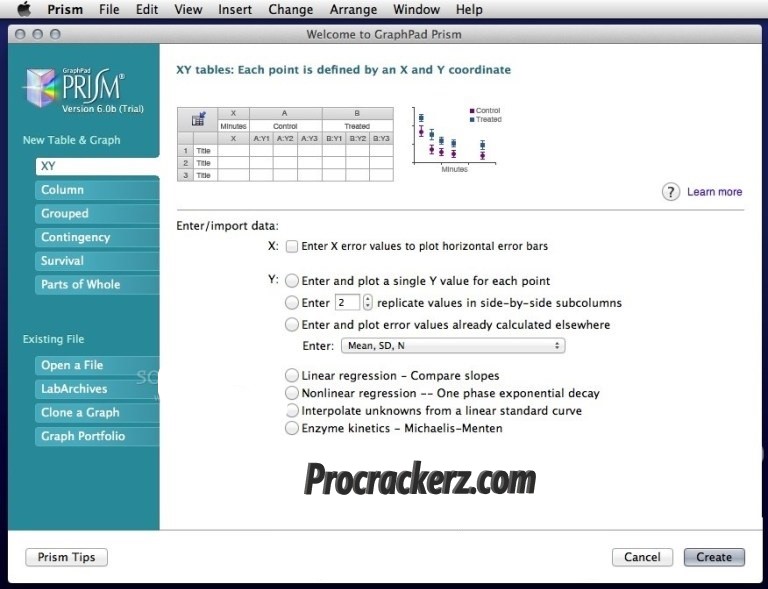
GraphPad Prism System Requirements?
- GraphPad Prism supports both 64-bit and 32-bit Windows Vista 10/8/7.
- Additionally, it is cooperative with macOS X 10.9 and is more powerful.
- This software needs at least 2 GB RAM.
- The software needs 60 MB space on Windows.
- 80-MB space on Mac.
- The screen display resolution must be 800×540.
- A stable internet connection.
How to Crack?
- Firstly, disable your protection of antivirus.
- Download the GraphPad Prism Crack file from the link given below here.
- After it opens the file and Installs the trial version on your system.
- Also, Run the crack file.
- With it activate the license.
- Now Enjoy the GraphPad Prism.
- All in all, download the Crack setup here (Download)
- Unlock the file with this password (procrackerz.com).
Summary
Review Date
Reviewed Item
GraphPad Prism Crack
Author Rating
5
Software Name
GraphPad Prism
Software Name
Windows/Mac
Software Category
Graphics, Software
To return to all sheets, tap “All”. Raw data can also be entered and plotted with SEM, SD, or confidence intervals. Prism updates graphs and results automatically when data are changed or updated. A mixed-effects model is used to analyze repeated measures data in one-, two, and three-way.
Password 123
Email us to request a link to the full installer if you are having trouble with the update. This request must include your serial number. Join thousands of scientists who use our online calculators every day to perform quick statical tests. Each sheet can be displayed by the Navigator as either a thumbnail or a name. You can choose between them by clicking the appropriate button in the upper right corner. Find the intersection point of both slopes and straighten lines between two data sets.
More sophisticated statistical analyses
Students only have access to the free course licenses that are activated for the duration of the course. The course is over and the course licenses are no longer valid. Comparing data from nested tables with nested ANOVA or a nested t-test. Two-way ANOVA even with missing values and some post-tests. The Prism demo cannot be updated.
Nonparametric Mann Whitney test, with a confidence interval of different medians. While running Prism 6.0a/6.0b/6.0c/6.0d/6.0e/6.0f/6.0g, drop the Help menu and choose Check For Updates.
Get guidance and insight at every step to help you make the right analysis decisions, understand the underlying assumptions and interpret your data accurately. GraphPad Prism makes it easy to analyze, graph, and present scientific work. One account may have files that you can see, but not another. To access the cloud service app, you will need to first open it and then log in again with your new account. Any cloud service that has the correct extension and app can be opened.
Fisher’s exact test and the chi-square test. Calculate relative risk and odds ratio using confidence intervals. You can run multiple t-tests simultaneously and use the False Discovery rate to determine which comparisons you want to investigate further. Automatedly generate volcano plots (difference vs. p-value) using multiple t-test analyses. You can customize the exports of Prism (file type, resolution, and transparency, dimensions, colorspace RGB/CMYK), to meet journal requirements.
You can also use tutorial data sets to help you understand the reasons behind certain analyses and how you should interpret them. Although scientists use curve fitting more often than any other statistical technique they use, many aren’t familiar with the principles. This guide will provide a brief introduction to fitting curves, particularly nonlinear regression. This versatile tool is designed for scientists, not statisticians. You can get a head start by entering data in tables designed for scientific research. These tables will guide you to statistical analyses that simplify your research workflow. GraphPad Software Inc., a California company privately owned, is a provider of GraphPad software.
Prism is the best program for fitting curves. Prism allows you to easily collaborate with peers, get feedback from peers, share your research with others, and even make it public. With ease, you can transform data into beautiful graphs that are published-quality. Prism allows you to modify your graphs in many ways, including color schemes and how you organize data. Export to almost any format, email, or send to PowerPoint directly from Prism.
Tukey, Newman Keuls, Dunnett Bonferroni, Holm Sidak, Fisher’s LSD multiple comparators testing main and minor effects. Prism’s complete record of all your data allows for effective collaboration with other scientists. You can easily share all parts of your Prism project in one file. This allows others to easily follow your work at each step, increasing clarity and streamlining collaboration. All graphs and results are updated automatically in real-time.
Concentrate your efforts on the most important data. To effectively analyze large data sets, you can customize the way you present them. Prism 6 is designed to appeal to a wider range of students and scientists. Prism is used by more than 750,000 scientists from 110 countries to share their research. Learn the science and art of data analysis and visualization with exclusive learning materials created by high-tech experts.
Graphpad Prism 6 System Requirements
- Operating System: Windows XP/Vista/7/8
- Memory (RAM): 512MB of RAM required.
- Hard Disk Space: 90MB of free space required.
- Processor: Intel Pentium 4 or later
GraphPad Prism 8.0 Free Download is a new smart software for preferred analysis and graphing solutions purpose-built for scientific research. You can get GraphPad Prism 8 free download 32 bit & 64 bit from Rahim-soft. that has a good system, applicable for all kinds of statistical analysis.
GraphPad Prism 8.0 Description
GraphPad Prism 8 free download is one of the statistics software products released by a private company called GraphPad. The GraphPad Prism 8 free download is capable of drawing any kind of 3D chart and is used to solve statistical problems.
Generally, this software is designed to solve scientific and business problems. GraphPad Prism offers various software solutions to solve extremely difficult. And difficult statistical problems at so the correct speed.
GraphPad Prism 8 download is provided by default for specific tasks, it is provided by beginners with statistical instructions. Advanced will help. Also, statistical analysis can be observed and analyzed at the end of each operation using software checklists to eliminate possible hazards in the integer data to zero. GraphPad Prism 8 download is now available for Windows and Mac OS.
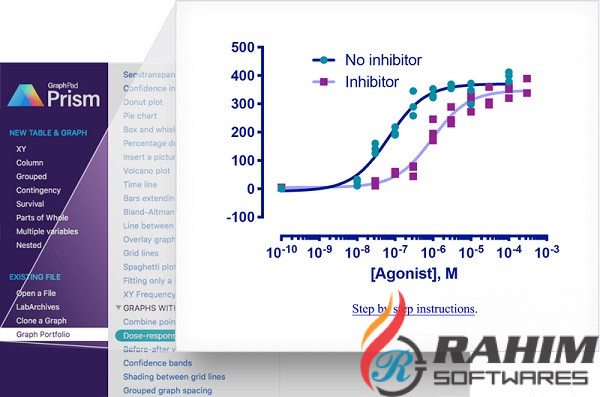
In GraphPad Prism 8 download, you can view or modify products while editing or editing data. find solutions to all statistical problems, such as automatically removing standard deviations from data size. Comparing models, comparing comparisons, and solving statistical problems with everything you need in the software.
Features For GraphPad Prism 8.0

- That can be while editing or editing data.
- A useful such as automatically removing standards.
- You can change drawing any kind of 3D chart and is also used.
- You can also advance will help.
- it was a useful system.
File information
- Name: GraphPad_Prism_8.0.2.263.rar
- File Size: 32-bit 30 MB, 64-bit 33 MB
- After Extract:32 bit 35 MB, 64 bit 39 MB
- Publisher: GraphPad
- File Type: Rar File
- Update Date: September 24, 2019
- Languages: English
Download 32 BitDownload 64 Bit
Password for File: 123
Back to top button