
Продолжая нашу серию статей, посвященных Power BI, мы рассмотрим сервер отчетов Power BI. Power BI, как технология представляет собой совокупность других технологий и сервисов. Сервер отчетов Power BI – один из важнейших компонентов экосистемы. Здесь мы узнаем о различных его аспектах:
- Основные характеристики
- Установка
- Работа/архитектура
- Компоненты
- Особенности последней версии
Что такое сервер отчетов Power BI?
Сервер отчетов Power BI – это локальный сервер отчетов, который используется для размещения отчетов Power BI. Отчеты, размещенные на локальном сервере отчетов, отображаются для пользователей на веб-портале. Вы можете размещать отчеты с разбивкой на страницы, мобильные отчеты и ключевые показатели эффективности на сервере отчетов, поскольку он построен на архитектуре службы отчетов SQL Server (SSRS). Вы можете получить доступ и просмотреть все типы отчетов на сервере отчетов с помощью веб-браузера, мобильного устройства или по электронной почте.
Использование локального сервера отчетов для размещения отчетов Power BI дает множество преимуществ. Он совместим со службой Power BI, вы можете легко интегрировать его с существующими службами Reporting Services. Кроме того, локальный сервер отчетов предпочитают многие организации исходя из соображений безопасности. Организации считают безопасным размещение важных отчетов в безопасном локальном решении, а не в облаке.
Возможности сервера отчетов Power BI
Как мы знаем, сервер отчетов работает на платформе SSRS, поэтому мы можем назвать его подмножеством SSRS. Будучи подмножеством, у него есть некоторые ключевые особенности и он играет важную роль. Ниже мы обсудим некоторые ключевые особенности:
- Сервер отчетов размещает отчеты Power BI локально. Можно обмениваться отчетами и сотрудничать с другими пользователями с помощью локального сервера отчетов. Кроме того, он имеет уникальную возможность развертывать и использовать мобильные отчеты (.rsmobile), отчеты с разбивкой на страницы (.rdl) и KPI.
- Он может отображать пользовательские визуализации. Пользователи, размещающие свои отчеты Power BI на этом локальном сервере, получают дополнительно к стандартным 100 настраиваемых визуальных элементов.
- Пользователи могут подключаться к нему из Power BI Mobile. Они могут легко получить доступ к отчетам с сервера отчетов. В настоящее время сервер отчетов поддерживается мобильными платформами iOS, Android, Windows.
- С локального сервера отчетов пользователи могут получать доступ к отчетам и взаимодействовать с ними на веб-платформе. Они могут использовать такие действия, как перекрестная фильтрация, всплывающие подсказки, срезы, исследование данных и т. д.
- Пользователи могут экспортировать данные из отчетов, размещенных на сервере отчетов, в файл формата CSV.
Как установить сервер отчетов Power BI?
Системные требования
Чтобы установить сервер отчетов, ваша система должна быть совместима с требованиями системы, представленными ниже:
- У вас должна быть одна из следующих платформ — Windows 10/Windows 8/Windows 8.1/Windows Server 2012/Windows Server 2012 R2/Windows Server 2016.
- .NET Framework 4.5.2 или новее.
- Ядро СУБД SQL Server (2008 или новее). Место для хранения базы данных сервера отчетов.
- Службы аналитики SQL Server (2012 SP1 CU4 или новее). Он необходим для ваших источников данных Live Analysis Services.
Шаги по установке сервера отчетов Power BI
Теперь давайте продолжим эту тему и рассмотрим процесс установки сервера отчетов.
Шаг 1. Перейдите в Центр загрузки Microsoft по приведенной ниже ссылке:
Скачайте сервер отчетов Power BI
Затем нажмите красную кнопку «Загрузить»

Шаг 2: Выберите файл для загрузки и нажмите «Далее».

Шаг 3: Запустится мастер установки. Щелкните «Установить сервер отчетов Power BI».

Шаг 4: Затем выберите версию, которую вы хотите установить. Вы получите бесплатную версию и премиум-версию.

Для премиум-версии вам необходимо ввести ключ продукта. Вы можете найти ключ продукта в настройках Power BI Premium.

Шаг 5: В следующем окне будут показаны условия лицензии. Отметьте «Я принимаю условия лицензии» и нажмите «Далее».

Шаг 6. Вам потребуется экземпляр ядра СУБД SQL Server. Установите переключатель «Установить только сервер отчетов Power BI» и нажмите кнопку «Далее».

Шаг 7: Затем укажите место установки и нажмите «Установить». Путь: C:\Program Files\Microsoft Power BI Report Server

Шаг 8: Нажмите «Настроить» после завершения настройки.

Архитектура сервера отчетов Power BI
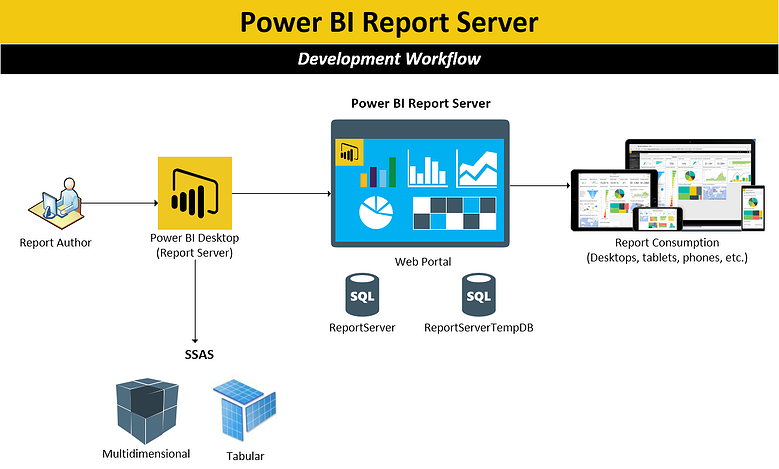
Взгляните на схему рабочего процесса ниже, чтобы лучше понять архитектуру и работу сервера отчетов.

Авторы отчетов работают с инструментами разработки Power BI, такими как Power BI Desktop, для создания отчетов. Отчеты разрабатываются с использованием данных из источников, доступных для подключения к Power BI. Когда отчеты готовы, вы переходите к серверу отчетов. На сервере размещаются отчеты, и отображается его веб-портал. Пользователи могут использовать отчеты, размещенные на сервере отчетов, через веб-портал. Они могут использовать веб-портал с любого устройства, которое его поддерживает, например, с настольных компьютеров, ноутбуков, планшетов и телефонов.
Компоненты сервера отчетов Power BI
С сервером отчетов связано несколько важных компонентов. Подробно о них читайте в разделах ниже:
1. Веб-портал
Веб-портал предназначен для отображения отчетов, размещенных на сервере отчетов Power BI. Вы можете получить доступ к веб-порталу из любого браузера последней версии. На веб-портале все отчеты и ключевые показатели эффективности загружены на сервер отчетов. Используя веб-портал, вы можете выполнять несколько действий, таких как доступ к отчетам по запросу, оформление подписки на опубликованные отчеты, применение пользовательских брендов к веб-порталу и планирование обработки отчетов. На веб-портале представлен разнообразный контент, такой как отчеты Power BI, мобильные отчеты, отчеты с разбивкой на страницы, ключевые показатели эффективности и книги Excel. Эти разные типы отчетов расположены в одинаковом порядке в традиционной иерархии папок. Отчеты сгруппированы по типам отчетов, как упоминалось ранее. Вы также можете получить доступ к общим наборам данных и общим источникам данных через отдельные папки на портале.
2. Отчеты Power BI
Самая важная часть всей концепции – это отчеты Power BI. Отчеты Power BI – это многостраничный информационный файл, представляющий модель данных посредством визуализаций. В Power BI Desktop есть множество типов визуализации, которые можно использовать для создания отчета. В отчете может быть несколько страниц с любым количеством визуализаций, которое вы хотите использовать.
Вы можете создавать отчеты (.pbix) на Power BI Desktop (оптимизированном для сервера отчетов). Позже вы можете опубликовать эти отчеты Power BI на веб-портале для просмотра и использования другими пользователями. Бизнес-пользователи и другие типы пользователей могут извлечь из этих отчетов важные знания и идеи.
На сервере отчетов размещаются еще два типа отчетов:
- Отчеты с разбивкой на страницы
- Мобильные отчеты.
- Отчеты с разбивкой на страницы
Отчет с разбивкой на страницы – это организованный отчет постраничного документа. Расширение, используемое для файла с разбивкой на страницы – .rdl. Отчеты с разбивкой на страницы сохраняются как документы с разбивкой на страницы, где вы можете развернуть документ по вертикали и горизонтали, чтобы просмотреть полные данные. Такие отчеты идеально подходят для пикселей с фиксированным макетом. Это может быть лучшим вариантом, если вы хотите распечатать отчет из файла PDF или Word.
- Мобильные отчеты
Второй тип отчетов, которые сервер размещает и публикует на своем веб-портале – это мобильные отчеты. Они похожи на отчеты Power BI, но могут быть адаптированы к экрану мобильного устройства, на котором вы их просматриваете.
Не забудьте прочитать – Как применять фильтры к отчетам Power BI
Самые свежие функции сервера отчетов Power BI
Мы перечислим несколько хороших новых функций последней версии здесь:
- Безопасность на уровне строк
- Диаграммы с поддержкой точечной диаграммы.
- Встроенные темы отчетов
- Фильтрация карточки в поиске.
- Улучшенная доступность отчетов.
- Помощь в улучшении редактора DAX.
- Повышение доступности моделирования.
- Новые функции DAX, такие как функции NonVisual, функция IsInScope.
- Новые настройки безопасности транспортного уровня.
- Улучшенные сочетания клавиш.
Также сюда добавлены такие функции, как развертывание и сворачивание заголовков строк матрицы, копирование значений и выборок из таблицы и матрицы, установка порядка табуляции, всплывающая подсказка для визуальных элементов кнопок и т. д.
Резюме
Это все, что вам нужно, чтобы понять принцип работы сервере отчетов Power BI. В этой статье мы кратко рассмотрели его основные концепции, такие как функции, процесс установки, архитектура и компоненты.


Introduction
Many organizations are reluctant to go to a cloud environment due to various reasons such as data privacy, security, compliance or data-sovereignty and data sensitivity. Power BI Report Server is the best option for those who have compliance issues, to keep their data in the cloud or Power BI online, and want to use Power BI reports for reporting, business intelligence and data analysis. In previous parts of this article, I have described what is Power BI Report Server, its features and how to install it. If you are new to this article, you can go through that What is Power BI Report Server and How to install it for understanding of Power BI Report Server. In this article I will describe the necessary steps to setup or configure Power BI Report Server for on-premises environment.
SQL Server Reporting Services is a part of the suite of SQL Server services. Additionally, Microsoft has provided Power BI Report Server in two ways: SQL Server Enterprise
edition with Software Assurance, and Power BI Premium license.
The configuration and setup of SSRS and Power BI Report Server is almost similar and people get confuse on it specially, regarding setup and usability. As I had got requirement for both SSRS and Power BI Report Server configuration in the same Windows Server, here in this write up, I will share how can we configure it.
This article will describe how to configure Power BI Report Server separately as well as in the same machine where SQL Server Reporting Services is up and running.
Let us follow below steps for Power BI Report Server setup.
Steps for Configuration
Open Report Server Configuration Manager. You may have SSRS (SQL Server Reporting Service) installed in your machine so, open it from Microsoft Power BI Report Server location. Otherwise, its setup may conflict with SSRS configuration and you may get error.
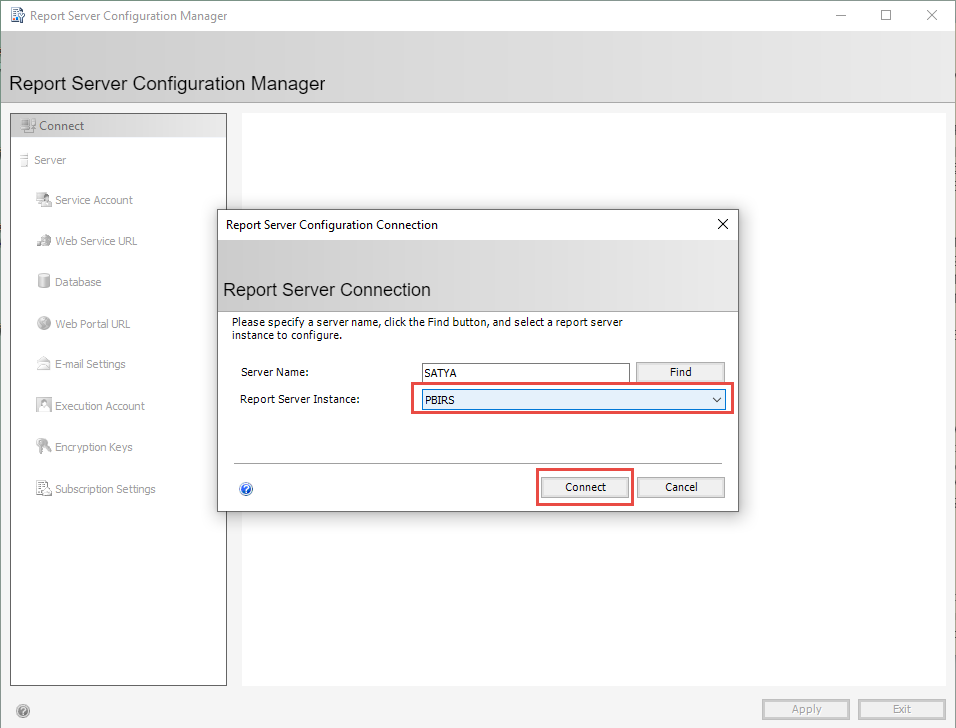
When you open it, then you will get the below screen. Choose Report Server Instance as PBIRS and click on Connect as depicted below.
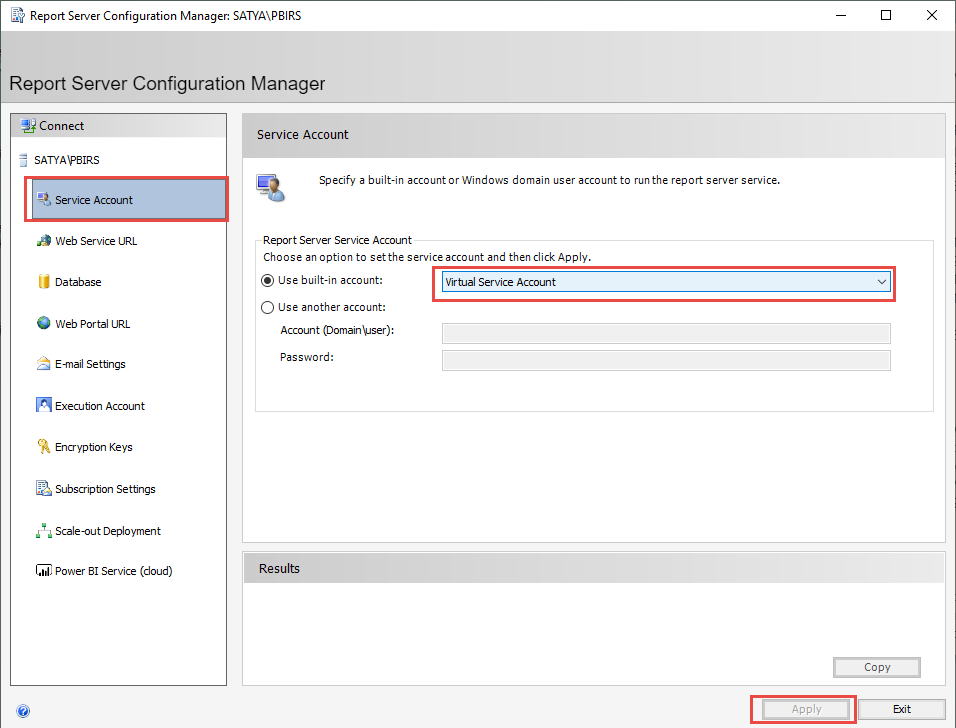
Go to Service Account and then select Virtual Service Account in Use built -in account option. You can select Use another account also and configure with Account (Domain\user) and Password as illustrated below. Then, click on Apply.
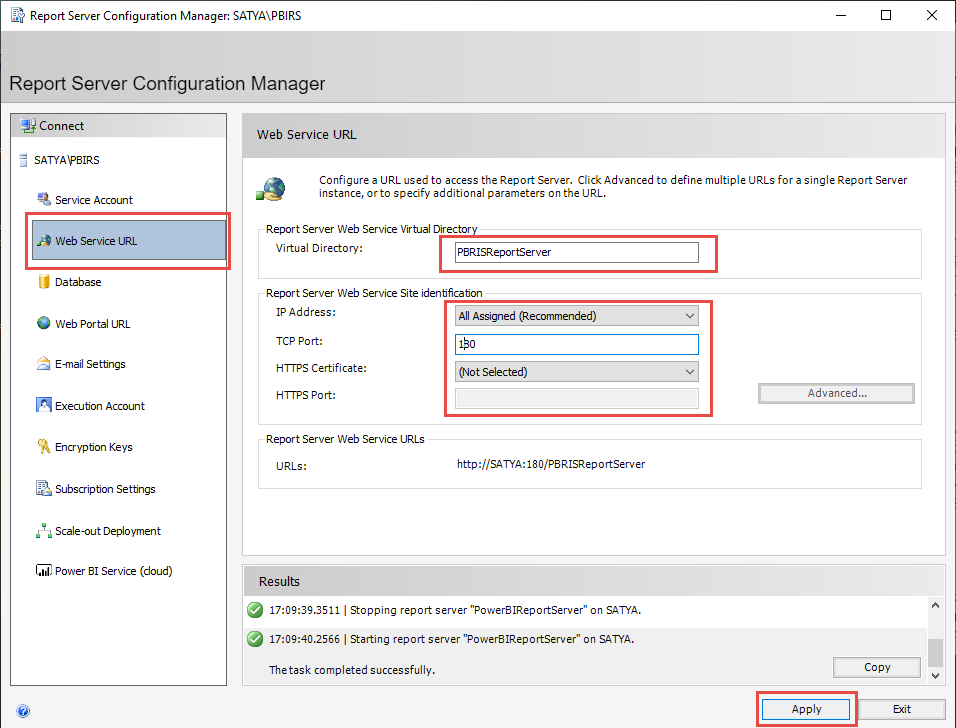
After that, go to Webservice URL. A Report Server virtual directory will be created by default. If you have your own Report Server Web Service Site then you can use its IP Address, TCP Port, HTTPS Certificate, and HTTPS Ports for your web service URL. Furthermore, you can choose default virtual directory as well as can choose default values for Report Server Web Service Site identification.
For my case, as I have already installed SSRS in my environment with default virtual directory, so I am changing Virtual directory for Power BI Report Server to different than the default. Also, my default port is already in use, so I am assigning different port for Power BI Report Server.
Then, click on Apply.
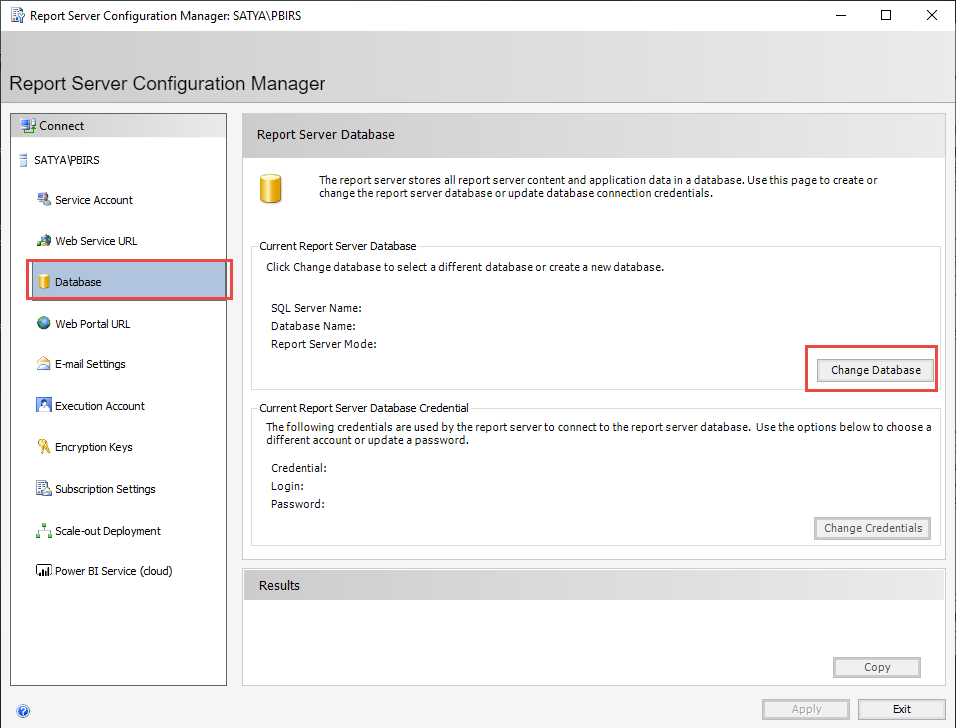
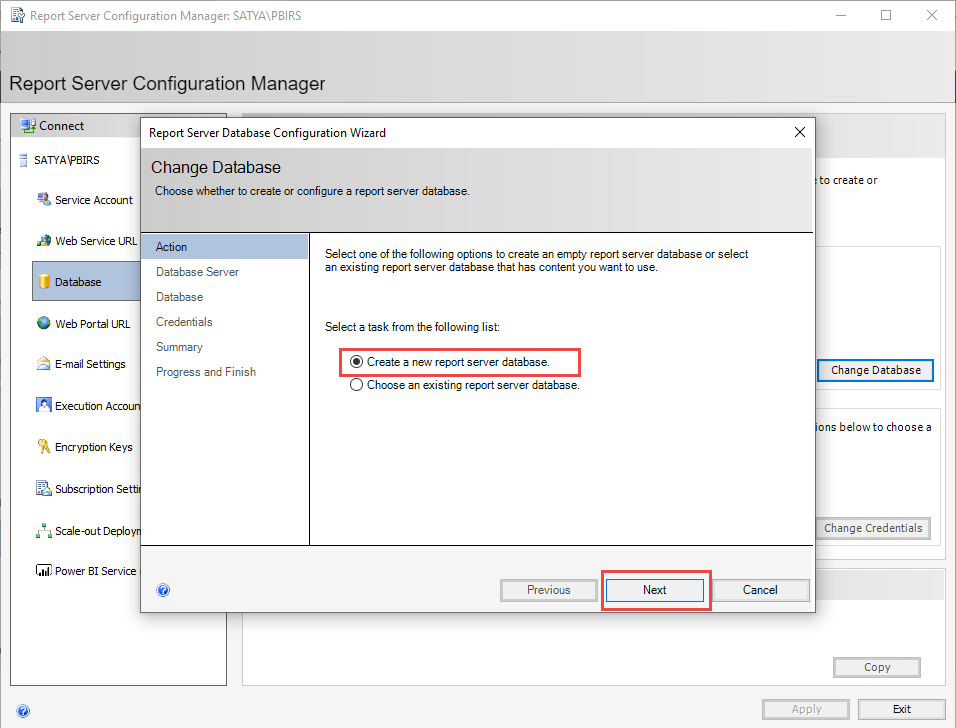
Go to Database then click on Change Database as shown below.
After that, you will get below screen. Select create a new report server database if you are creating a report server database for the first time. However, you can select choose an existing report server database if you have already installed a report service. Then click Next.
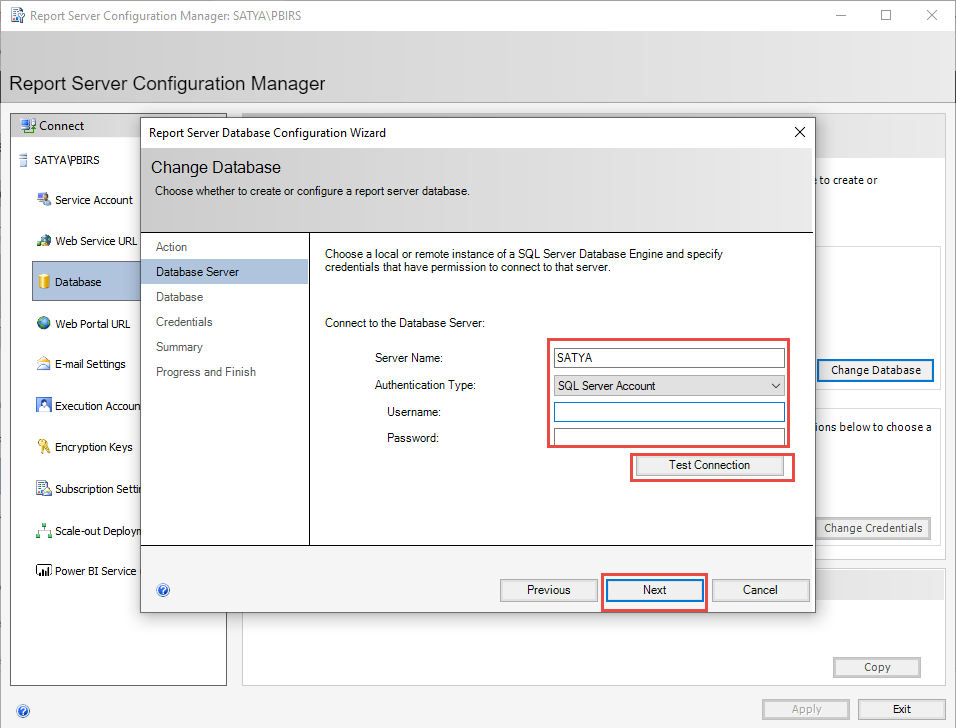
Database Server
Insert your Server name then select Authentication Type as SQL Server Account, Username, Password, and then Test Connection. If your test connection is succeeded, then click on Next.
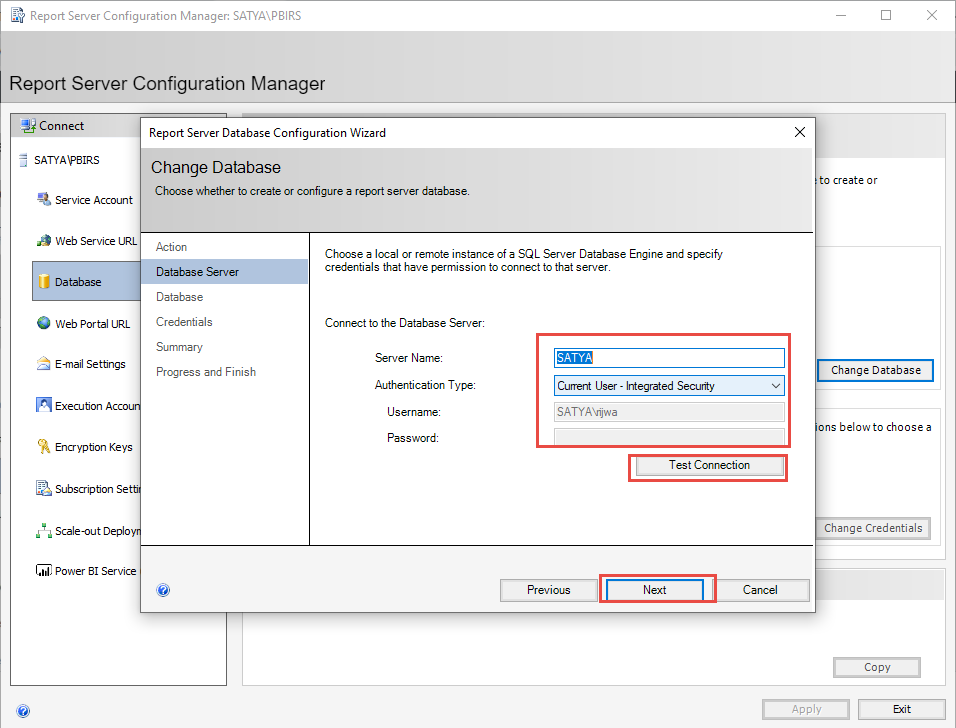
However, you can continue setup with default values as illustrated below.
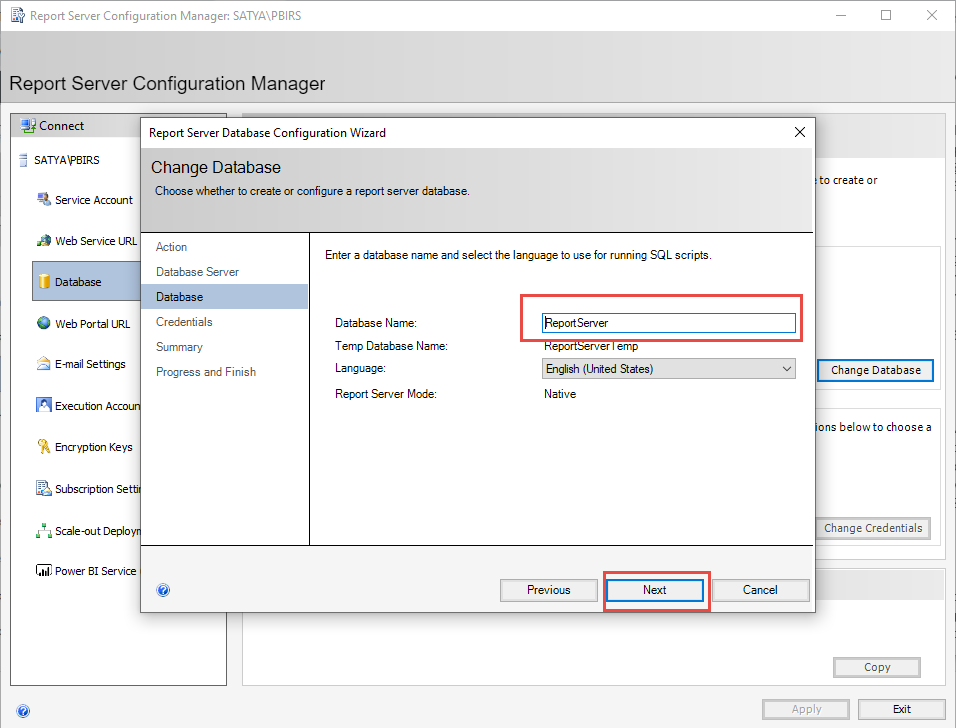
Database
Choose Report Server Database Name as report server (default name) and click Next. Alternatively, you can give another name for database. In my scenario, I am giving different name to my Database than the default value.
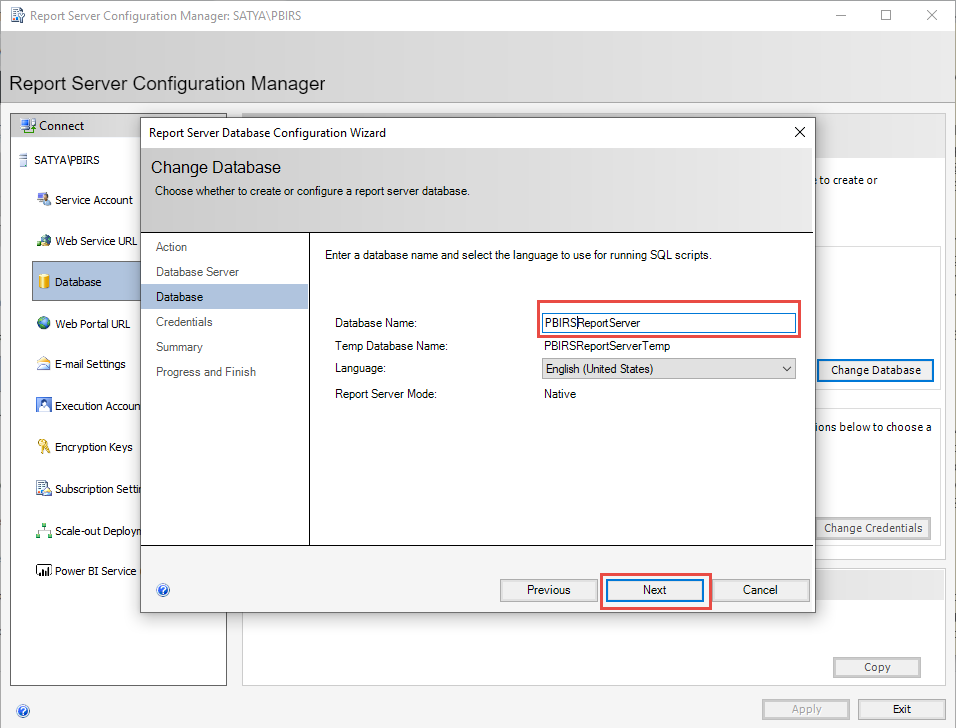
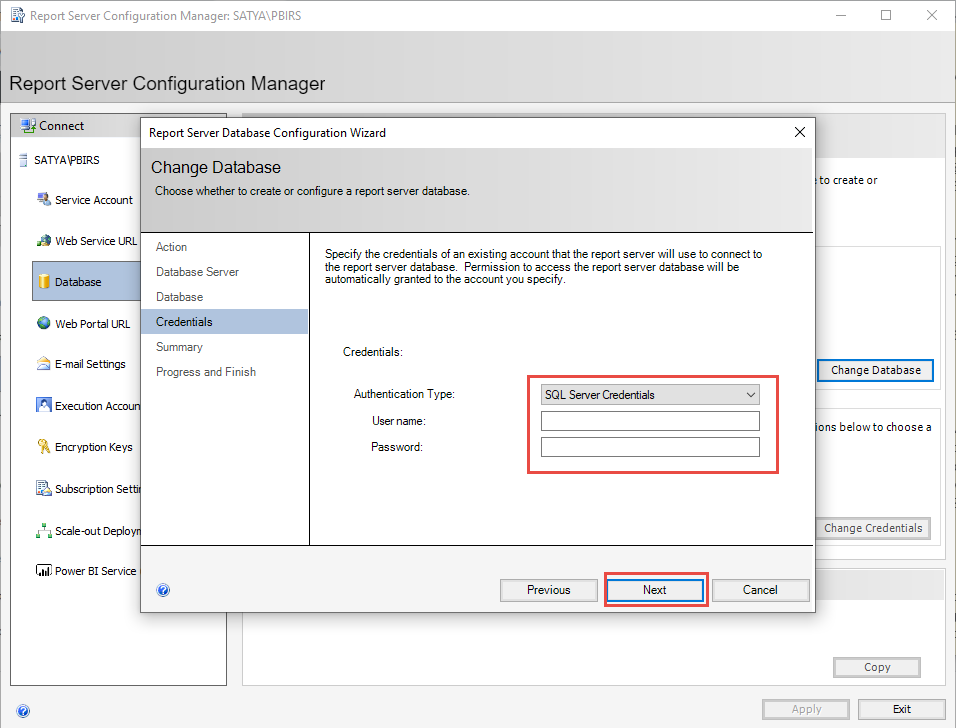
Credential
Select Authentication Type as SQL Server Credentials, insert username and password, then click Next as depicted below.
If you have selected default values in Database server selection in previous step, then you can go with default values here also.
You can see details of setup in summary wizard. Click on Next in the summary wizard.
It may take few minutes to complete the setup.
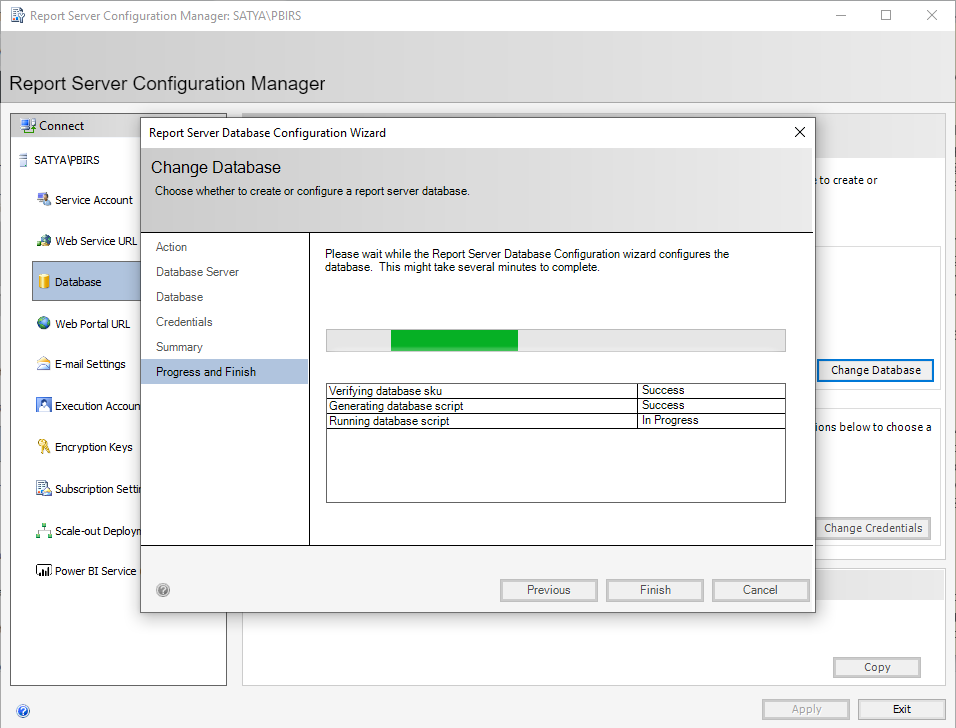
When the setup is successful, click on Finish.
Now, setup is completed. You can, go to Web Portal URL. You can see default virtual directory there with which you can Apply the setting. Additionally, if you want to change the Virtual directory just Put different virtual directory name than the default value and click Apply. I have already installed SSRS with the default Virtual directory, so I have changed the directory name in my case.
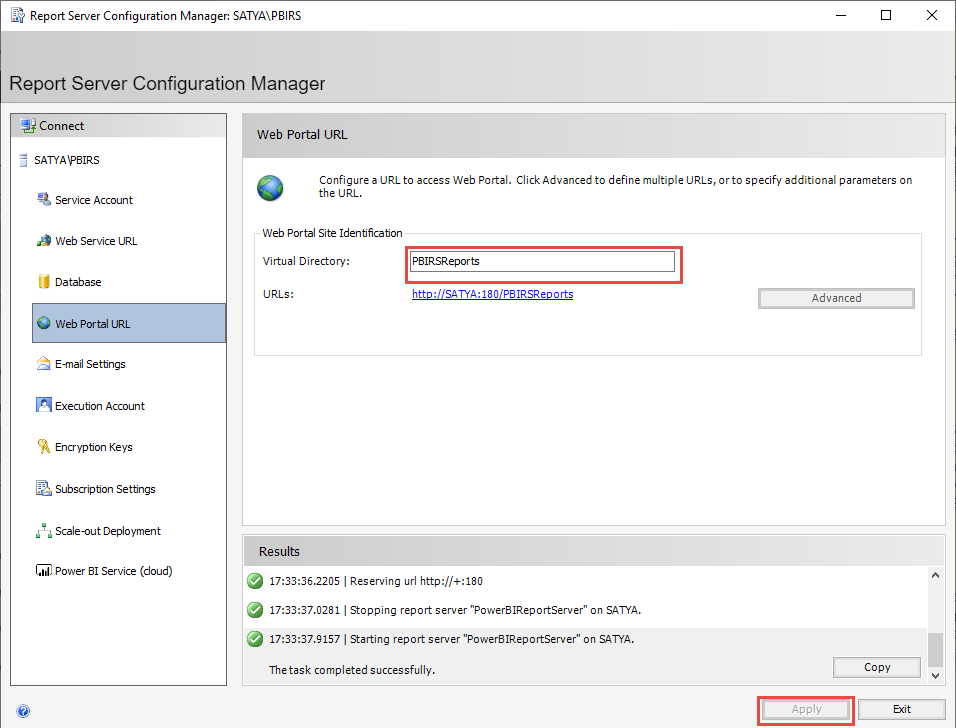
Now, Click on URLs available on above screen or you can simple type URL in the browser to open the Power BI Report Server.
Your Power BI report server will be open in the browser as shown like below.

Conclusion
Hence, this article has described how to configure Power BI Report Server on-premises. After configuration, you can upload your report files in the Power BI report Server. I hope, it will help you to configure Power BI Report Server in separate machine or in the same machine where already SSRS is running successfully.
The benefits of Business Intelligence and Data Visualization are becoming increasingly evident to business organizations around the world. Power BI is a Business Intelligence Service that is employed by many of these organizations to implement these useful techniques on their business data maintained in their Cloud Data Warehouse.
There are numerous instances when users require access to Power BI reports on multiple devices. These devices may not have the processing power to host/run the complete version of Power BI Desktop, and sometimes these reports are even required to be shared over email. In these scenarios Power BI Report Server can prove to be a very useful and effective tool.
In this article, you will learn in detail about Power BI Report Server, Its key features, and the steps to set up Power BI Report Server. You will also learn how to create and launch reports on the Power BI Report Server to access them on the web portal.
Table of Contents
- What is Power BI?
- Key Features of Power BI
- What is Power BI Report Server?
- Key Features of Power BI Report Server
- Power BI Report Server Version
- Elements of Power BI Report Server
- Web Portal
- Power BI Reports
- Paginated Reports
- Mobile Reports
- Steps to Set Up Power BI Report Server
- Launching Reports on Power BI Report Server
- Step 1: Initialising Power BI Desktop Now
- Step 2: Selecting the Data Source
- Step 3: Designing the Report
- Step 4: Saving the Report
- Conclusion
What is Power BI?

Power BI is a Cloud-based Business Intelligence tool that is used to analyze and create Data Visualization in real-time. The user can leverage data from multiple sources to create Business Reports, Interactive Dashboards to get essential insights that help in strategic business decision making.
Power BI solution consists of various sub-platforms Power BI Desktop, Power BI Service [SaaS based Solution], and various other app-based mobile solutions. The functionality to create illustrative and data-driven Reports and real-time Dashboards help business organizations to find answers to the right questions and provide an objective basis for decision making for the management of the organization.
Key Features of Power BI
- Interactive Interface: The Power BI interface is based on an easy-to-learn Drag and Drop UI. The reports can be created using the data without requiring any programming knowledge.
- Customizable Data Visualizations: The platform provides various default templates that can be utilized by different organizations according to their requirements. Further, it provides complete customization of its templates to fit the needs of the Report / Dashboard creation.
- Secure Platform: Power BI uses a feature called Active Directory to set up access to the control panel. Along with the traditional security layer, the platform is designed to develop and create security where every user is granted access to data in a controlled manner.
- Easy Implementation: The platform requires little IT resources to be set up across the organization/department and inculcate in the workflow. Many aspects of report creation do not require any programming knowledge.
Power BI Report Server is an On-Premise Report Service solution. It offers a web portal that can help you display and manage Reports & Dashboards.
The platform is based upon SQL Server Reporting Services [SSRS] architecture that helps you access your Reports using a Web Browser, Mobile Device, or Email. Official Documentation regarding Power BI Report Server can be found here.
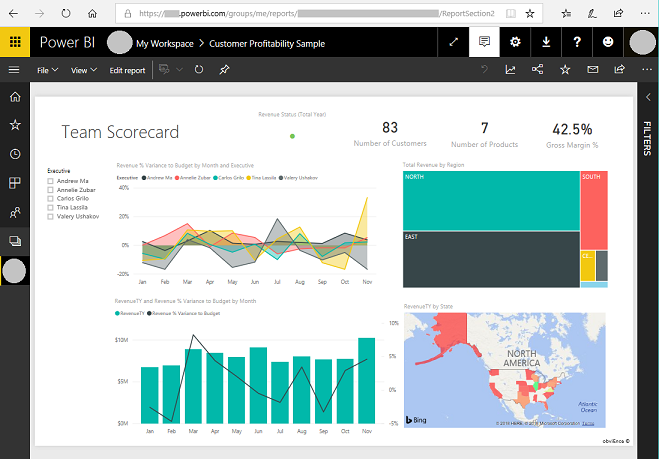
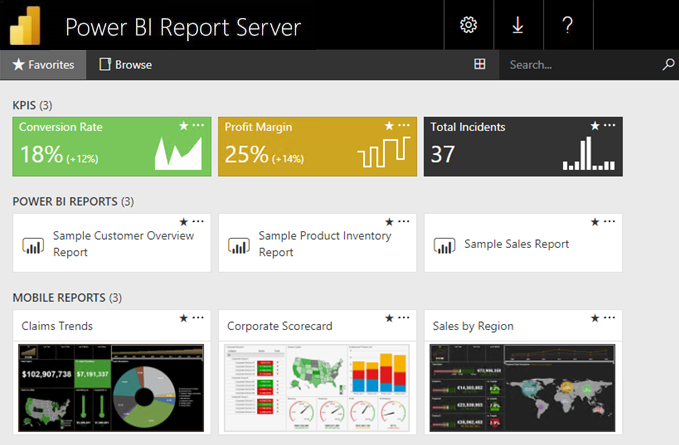
Below you can check out a screenshot of the Power BI Report Server web portal:

Key Features of Power BI Report Server
- On-Premise Capabilities: The reports on Power BI Report Server are hosted on-premises. On-Premise solutions promote secure collaborations between users. There is also a provision to host .rsmobile – Mobile Reports and .rdl – Paginated Reports and KPI Dashboards.
- Custom Visualizations: It provides the capability to render custom visualizations. [100 additional customizations were added to the default ones]
- Mobile Connectivity: The reports stored can be accessed using Power BI Mobile using mobile connectivity. Platforms including iOS, Android, Windows Mobile Platforms are supported.
- Data Export: It provides the functionality to export data into format files like CSV .xlsx etc.
Power BI Report Server Version
In this section of the Power BI Report Server, you can learn about the recent versions released by the Power BI Report Server. These versions contain major feature updates in areas like Reporting, Modeling, Paginated Reports, and many others.
You can find detailed information on those by visiting the following page:
Power BI Report Server (PBIRS) Versions
Elements of Power BI Report Server
Following are the key elements of the Power BI Report Server:
- Web Portal
- Power BI Reports
- Paginated Reports
- Mobile Reports
1. Web Portal
The main interface with which the user would interact the most is the secure Web Portal of the Power BI Report Server. In this portal, the user can access their Report, Dashboards, and KPIs from any device that is capable of running a modern browser.
The interface is easy to use and the files are displayed in a traditional folder hierarchy. The content is also categorized into categories as Power BI reports, Mobile Reports, Paginated Reports, KPIs, and Excel Workbooks. The Web Portal also provides the functionality to schedule report processing, access reports on demand, and subscribe to published reports.
2. Power BI Reports
Power BI Reports are multi-perspective views of data visualizations to represent and analyze the target dataset. This functionality allows the user to create .pbix reports on Power BI Desktop and then publish them across the web portal and view them according to their convenience.

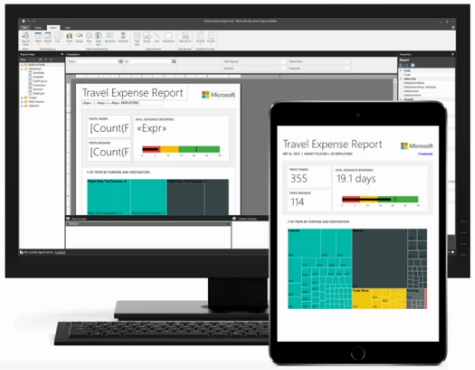
3. Paginated Reports
These are the type of reports in which tables expand both horizontally and vertically. They are.rdl format documents that generate files that are optimized for printing, for example, PDF and Word Files.
4. Mobile Reports
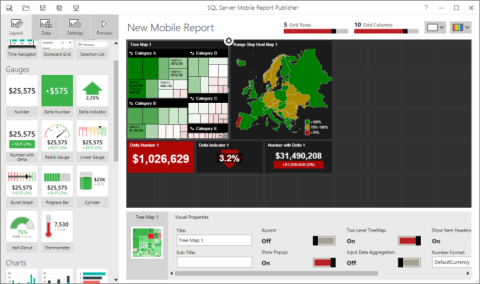
These are the types of reports which can be accessed by connecting to an On-premise server. These reports offer an interactive layout that adapts to the different screen sizes and aspect ratios of mobile devices. They are usually created using SQL Server Mobile Report Publisher.
Hevo Data, a No-code Data Pipeline helps to transfer data from 100+ sources to a Data Warehouse/Destination of your choice and visualize it in your desired BI tool such as Power BI. Hevo is fully managed and completely automates the process of not only loading data from your desired source but also enriching the data and transforming it into an analysis-ready form without having to write a single line of code. Its fault-tolerant architecture ensures that the data is handled in a secure, consistent manner with zero data loss.
It provides a consistent & reliable solution to manage data in real-time and always have analysis-ready data in your desired destination. It allows you to focus on key business needs and perform insightful analysis using a BI tool of your choice.
Check out what makes Hevo amazing:
- Secure: Hevo has a fault-tolerant architecture that ensures that the data is handled in a secure, consistent manner with zero data loss.
- Schema Management: Hevo takes away the tedious task of schema management & automatically detects schema of incoming data and maps it to the destination schema.
- Minimal Learning: Hevo, with its simple and interactive UI, is extremely simple for new customers to work on and perform operations.
- Hevo Is Built To Scale: As the number of sources and the volume of your data grows, Hevo scales horizontally, handling millions of records per minute with very little latency.
- Incremental Data Load: Hevo allows the transfer of data that has been modified in real-time. This ensures efficient utilization of bandwidth on both ends.
- Live Support: The Hevo team is available round the clock to extend exceptional support to its customers through chat, email, and support calls.
- Live Monitoring: Hevo allows you to monitor the data flow and check where your data is at a particular point in time.
Simplify your data analysis with Hevo today! Sign up here for a 14-day free trial!
Steps to Set Up Power BI Report Server
Step 1: You can download the software by visiting the link here and clicking on “Download Free Trial”
Step 2: Find the downloaded file and launch the installer.
Step 3: Select Power BI Report Server.
Step 4: Select the edition you would want to set up and click on “Next”. You will be given a choice between Evaluation or Developer Edition.
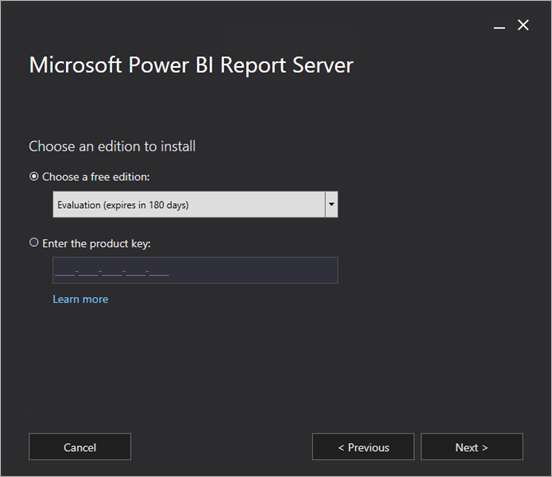
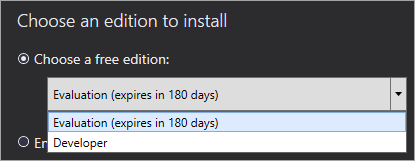
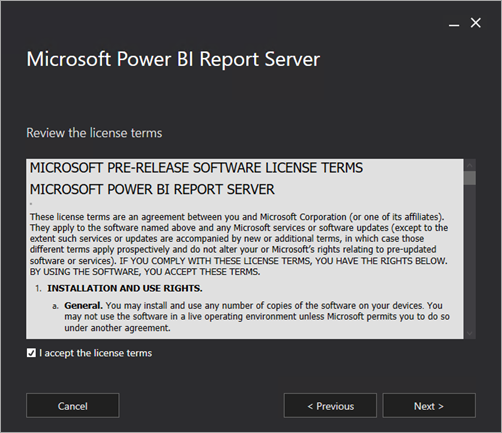
Step 5: Agree to all the terms and conditions and continue the installation process by clicking on “Next”.
Step 6: Subsequently you would be required to install a Database Engine to store the data from the Power BI Report Server.
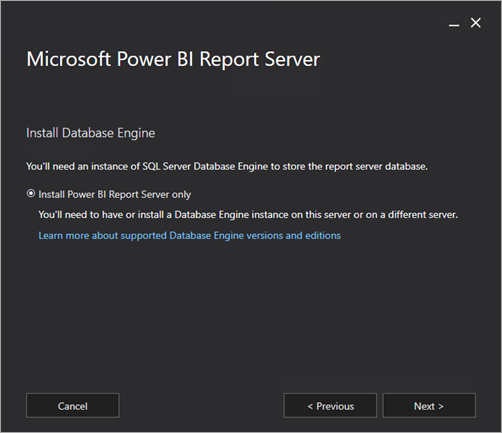
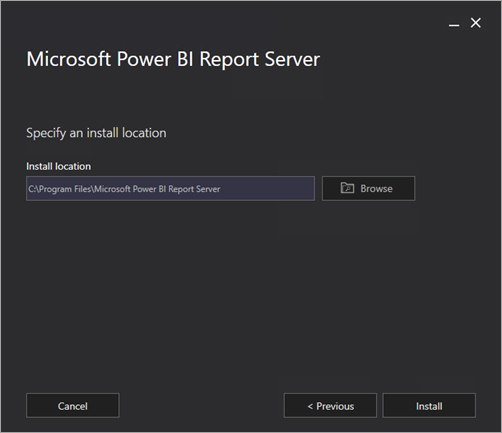
Step 7: The user is required to specify an install location for the software. To continue with installation after making the required changes select “Install”.
If you require more information regarding the installation of the Power BI Report Server, it can be found here.
Launching Reports on Power BI Report Server
Following are 4 major steps that are required to launch Reports on Power BI Report Server.
- Step 1: Initialising Power BI Desktop Now
- Step 2: Selecting the Data Source
- Step 3: Designing the Report
- Step 4: Saving the Report
Step 1: Initialising Power BI Desktop Now
Firstly you would be required to set up and initialize Power BI Desktop Now. You may choose the 32-Bit or 64-Bit version according to your requirement.

Step 2: Selecting the Data Source
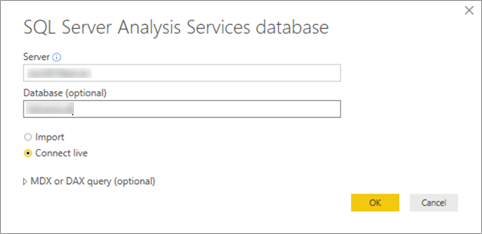
On the Welcome screen while operating “Power BI Desktop Now” users will be required to select “Get Data”. In the list of the available data sources, select “Analysis Services”.

In the subsequent window, select “Server”, and ensure that Connect Live is selected as “OK”.
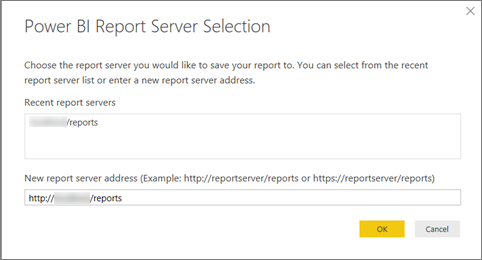
Then choose the Report Server where you want to store your Power BI Reports.
Step 3: Designing the Report
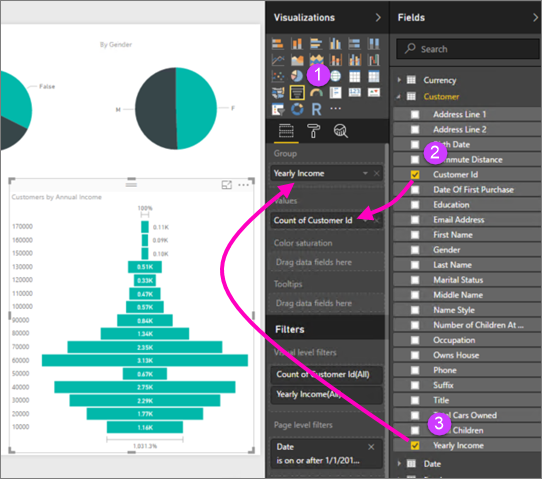
In this step, you would be required to create the desired report based on the dataset being leveraged. The report creation is fairly easy to use and it is based on the Drag and Drop user interface.
Step 4: Saving the Report
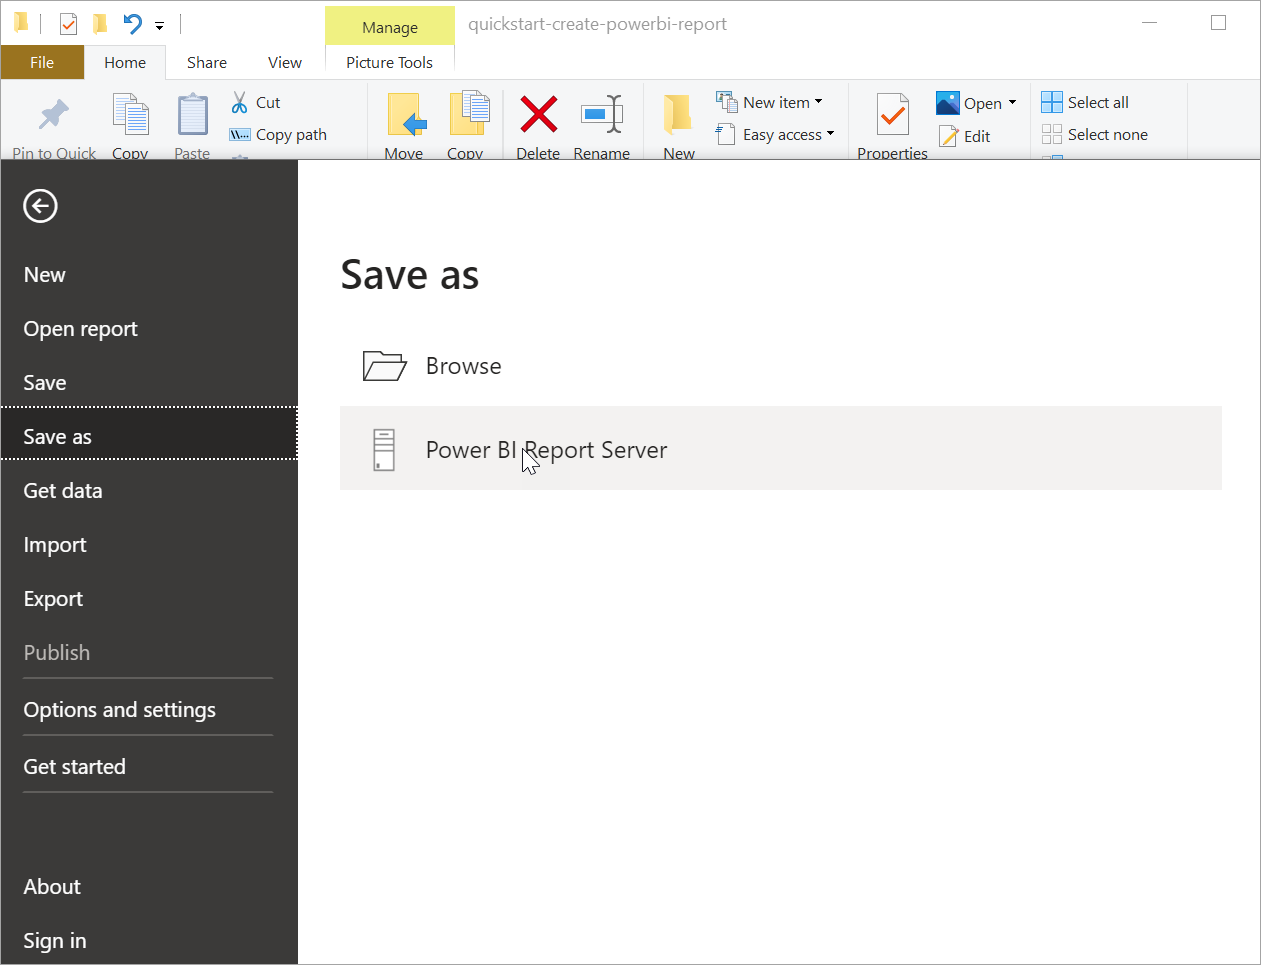
Once the Illustrative Report is created according to the requirements, the user should proceed to Saving the report on the server. Start by selecting “Power BI Report Server” in the “Save as” option in the File menu.
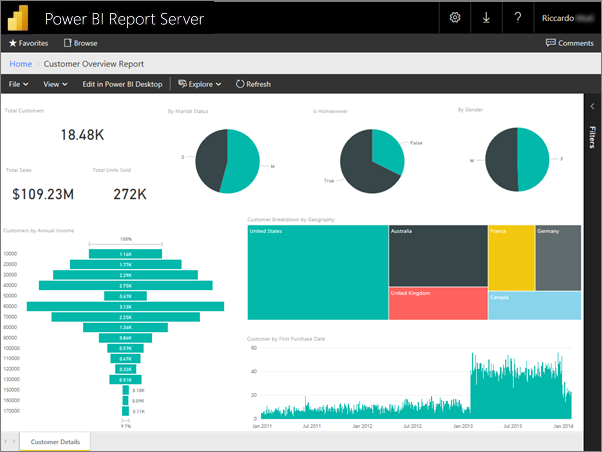
The report can now be viewed in the Power BI Report Server web portal and other supported services.
More information regarding hosting reports on the Power BI Report Server can be found here.
Conclusion
In this article, you learned in detail about Power BI Report Server, Its key features, steps to set up Power BI Report Server, and how to create and launch reports on the server to access them on the Web Portal.
Integrating and analyzing data from a huge set of diverse sources can be challenging, this is where Hevo comes into the picture. Hevo Data, a No-code Data Pipeline helps you transfer data from a source of your choice in a fully automated and secure manner without having to write the code repeatedly.
Hevo with its strong integration with 100+ sources & BI tools, allows you to not only export & load Data but also transform & enrich your Data & make it analysis-ready in a jiffy.
Get started with Hevo today! Sign up here for a 14-day free trial!
Power BI
3 Minutes
Microsoft Power BI is not only a cloud-based reporting technology, but also you can implement your power bi solution on-premises. Some businesses prefer not to leave their data on-premises environment. Based on that demand Power BI has an option to deploy fully on-premises. It’s a specific edition of SQL Server Reporting Services. Power BI report server can host Power BI Reports as well as Reporting Services (SSRS) Reports.
This post covers how to install Power BI Report Server, and all requirements and configuration for Power BI Report Server.
You can download the latest edition of Power BI Report Server from below link.
https://powerbi.microsoft.com/en-us/report-server/
There are two installation items :
- Power BI Report Server
- No need to have SQL Server installation disk. The Report Server comes with its setup files.
- Power BI Desktop Report Server edition (32 and 64-bit versions)
- Use to create Power BI reports. Otherwise, reports cannot be hosted on the Power BI report server.
1. Installing Power BI Report Server
- Run the setup file.
- You can choose either the evaluation edition (valid for six months) or the licensed version. In this demo, I’m going to choose the evaluation edition.
- Click Next.

- Then you have to accept the license terms. Click Next.

- To run the report server we need a SQL Server database engine. Don’t worry If you are not installed SQL Server, because this setup will install the database engine.
- Click Next.

- Specify an install location. Click Install.

- Once complete the setup, you can open the configuration section. Click “Configure Report Server”.

2. Configuring Power BI Report Server
- Then you need to connect to the server that you’ve just installed. Initially, the instance name of this server is PBIRS.

- After connecting to the server, the following window will appear.

Then we have to configure the server.
- Steps to configure the server.
- Configure Databases
- Web URL Set Up
- Report Server needs to web URLs to work; The web service, and the web portal
1. Configure Databases
- Click on the Database in the left side tabs and then click on Change Database.

Database Set Up
Create databases for the report server using Change Database wizard;
- Select “Create a new report server database” option and then click on Next.

- Then you need to connect to the SQL Server database instance. The report server databases will be created there.
- Enter the database server and username and password.
- After that test the connection by clicking Test Connection.

- Choose the database name (default is ReportServer).
- There is a second database called Temp database. No need to configure that.
- Click “Next”.

- Give credentials and continue the wizard.

- And the summary will appear like this.

- After confirming things in the Summary step, it shows a successfully set up of database creation window.
- Click on Finish.

2. Web URL Set Up
- Report Server needs to web URLs to work;
- Web Service
- Web Portal
2.1 Web Service Set UP
- Click on the Web Service URL in the left side tabs
- You don’t need to change anything here if you wish to set up with a basic set up.
- click on Apply.

- Then you should see messages and a URL that you can click on to open report server’s web service.

2.2 Web Portal Set Up
- Click on Web Portal URL in the left-hand side tabs
- Do some configuration if you want for the service.
- Then click on Apply.

- Then you would see the success message, and you can click on the web portal URL to open it in a browser window.

- Once you click the URL you will get the window like below. There is no content in the server yet.

Installation and configuration of the Power BI report Server are now finished. Click “Exit” to finish.
Hope this post helped you to get an idea about how to Installation and configuration of the Power BI report Server. Will meet you again in my next blog post “How to implement and deploy a report in Power BI report server”.
Cheers… 🙂

Published by Samudra
I’m a Data Analytics and BI professional who has 7+ years of experience in IT industry with exposure to Microsoft and Oracle Business Intelligence stack. I come with a Degree in ICT from the Rajarata University of Sri Lanka. I have exposure to work with various database and cloud technologies including Azure SQL/Microsoft SQL Server, Oracle, MySQL and data integration tools like Azure Data Factory, SSIS. Currently I’m reading the Nano Degree program on Data Engineering at Udacity. In my professional life, I’m working as Assistant Manager — BI & Analytics at HealthRecon Connect LLC. I share my knowledge with the technological community by writing blog posts, conducting sessions at Sri Lanka Data Community (SLDC) and recently spoke at New Stars of Data.
View all posts by Samudra
Published
10 Jan 2022
The advantages of Business Intelligence and Data Visualization are becoming more apparent to companies all around the world. Many of these firms utilize Power BI, a Business Intelligence tool, to deploy these valuable strategies on their business data, which is stored in the Cloud Data Warehouse and a variety of other places. Users may need access to these reports on many devices in a variety of situations. These devices may not have the processing power to host/run the full version of Power BI Desktop; in some cases, reports must be sent over email. Power BI Report Server can be a very valuable and effective tool in these situations.
In this blog, you will understand in-depth about Power BI Report Server, and Its key features.
Introduction to Power BI
Power BI is a cloud-based business intelligence solution that allows you to analyze and visualize data in real-time. It enables users to combine data from a variety of sources to generate Corporate Reports and Interactive Dashboards that provide critical information for strategic business decision-making. Power BI Desktop, Power BI Service [SaaS-based Solution], and several other app-based mobile solutions make up the Power BI solution.
The ability to develop graphical and data-driven reports as well as real-time dashboards aids business organizations in finding answers to the correct queries and providing an objective foundation for management decision-making.
Key Features of Power BI
Interactive Interface: The Power BI interface is based on an easy-to-use Drag and Drop user interface. The data can be used to build reports that do not require any programming experience.
Customizable Data Visualizations: The platform has several default templates that may be customized to meet the needs of different businesses. It also allows total customization of its templates to meet the requirements of the Report / Dashboard creation.
Secure Platform: Power BI sets up access to the control panel using a function called Active Directory. The platform is meant to develop and create security where each user is provided regulated access to data in addition to the usual security layer.
Easy to Implement: The platform is easy to set up and integrates easily into the workflow across the organization/department with little IT resources. Many components of report authoring do not necessitate any programming experience.
Related Reading: What is the Difference Between Power BI Desktop and Power BI Service?
What is Power BI Report Server?
Power BI Report Server is a report server that runs on-premises and hosts Power BI reports. Users can access the reports hosted on the on-premises report server using a web interface. Because the report server is based on the SQL Server Reporting Service (SSRS) architecture, it may also host paginated reports, mobile reports, and KPIs. You can use a web browser, a mobile device, or email to access and read all types of reports on the report server.
There are numerous benefits to hosting Power BI reports on an on-premises report server. It is Power BI Service compatible, and you can easily combine it with your existing Reporting Services.
(Source: Microsoft)
Key Features of Power BI Report Server
On-Premise Capabilities: The reports on Power BI Report Server are hosted on-premises. On-premise solutions encourage users to collaborate securely. There is also the option of hosting. .rdl — Paginated Reports and KPI Dashboards, and mobile – Mobile Reports
Custom Visualizations: It allows you to create your visualizations. [In addition to the basic customizations, 100 more were added]
Mobile Connectivity: Reports stored in Power BI Mobile can be accessed via mobile connectivity. Platforms such as iOS, Android, and Windows Mobile are supported.
Data Export: It allows you to export data to CSV and.xlsx files, among other formats.
Power BI Report Server Components
The Power BI Report Server has the following major components:
Elements of Power BI Report Server
Following are the key elements of the Power BI Report Server:
- Web Portal
- Power BI Reports
- Paginated Reports
- Mobile Reports
Web Portal
The secure Web Portal of Power BI Report Server is the primary interface through which the user will interact. The user can view their Reports, Dashboards, and KPIs from any device that can run a modern browser through this portal. The files are organized in a regular folder system, and the interface is simple to use. Power BI reports Mobile Reports, Paginated Reports, KPIs, and Excel Workbooks are among the categories of content. The Web Portal also allows you to schedule report processing, view reports on demand, and subscribe to reports.
Power BI Reports
Power BI Reports are multi-perspective data visualizations that are used to depict and analyze a specified dataset. This feature allows users to create.pbix reports in Power BI Desktop and then publish them to the online portal, where they can be viewed at their convenience.
Paginated Reports
These are reports that have tables that expand both horizontally and vertically. They are papers in the. rdl format that generates files that are optimized for printing, such as PDF and Word files.
Mobile Reports
These are the types of reports that can be accessed with an on-premise server connection. These reports include an interactive interface that adjusts to multiple mobile device screen sizes and aspect ratios. SQL Server Mobile Report Publisher is commonly used to build them. Integrating and analyzing data from a huge set of diverse sources can be very difficult, this is where Veelead comes into the picture. Veelead, with its strong integration with 100+ sources & BI tools, allows you to not only export & load Data but also transform & enrich your Data & make it analysis-ready in a jiffy.
At a Glance
Introduction
What Why How…
Installation
Configuration
Introduction
The Power BI Report Server is a new, standalone product that allows organizations to host Power BI Reports on an on-premises report server. Additionally, the Power BI Report Server is built upon the same architecture as SQL Server Reporting Services, allowing you to also use the server to host paginated reports, mobile reports, and key performance indicators (KPIs), thus creating a “one-stop shop” for all your reporting assets.
What
Power BI Desktop as a powerful tool for self-service BI and creating interactive reports. It offers data warehouse capabilities, including data preparation, data discovery and interactive dashboards.
Self-service BI using Power BI provides the tools you need to find data, shape and filter it how you want, model it, and visualize. Data visualization is a quick and easy way to convey concepts or information in a universal manner. Data visualization can help to:
- Analysis capabilities of business processes or activities
- Get factors that give better insights.
- Drive better decision making
- Make proper predictions.
- Providing an integrated view
Why
Power BI gives cloud-based BI services, known as “Power BI Services”, along with a desktop based interface, called “Power BI Desktop”. Sharing reports with business users the on-premises solution requirement arrived. On-premises solution to host Power BI Reports are required due to several reasons:
- Complement the Power BI Service
- Highly Regulated Customers
- Integrate into existing investment in Reporting Services
Power BI reports in SQL Server Reporting Services combination of Power BI Desktop’s interactive report capability with SQL Server Reporting Services’ on-premises server platform.SQL Server 2017 will continue to include Reporting Services for on-premises enterprise reporting.Comparison view :

Source: SQL Server Reporting Services Team Blog
With Power BI Desktop and Power BI Report Server, you can
- Create beautiful, interactive reports using Power BI Desktop
- Publish reports to Power BI Report Server
- View and interact with reports in your web browser or in Power BI Mobile on your phone or tablet
How :
Power BI Report Server. With its small file size and simplified wizard, you can download and install Power BI Report Server in minutes. because it’s separate from SQL Server setup, you can install Power BI Report Server updates knowing they’ll have zero impact on your SQL Server deployments and databases.
The same Power BI reports you create for Power BI Report Server can work in the Power BI service and even continue to query your on-premises data via the On-premises Data Gateway.

Install Power BI Report Server
Power BI Report Server release notes : It’s better to take a look on release notes to
Hardware and software requirements: It’s an important to know & check the installation requirement from Microsoft site.
Download Free trial form Power BI site:
1. On-premises reporting with Power BI Report Server October 2017
2. Power BI Desktop (October 2017)
3. For Sample Data (if required to explore) you can download Dataware House WideWorldImporters database backup .

Step 1 :Run the PowerBIReportServer file that you downloaded .Now you have to select the edition from the drop down.

Step 2 :It’s simple installation steps within that step you have to agree Licencing teems , assign Installation path .
Step 3 :After installation completion ,run the Report Server configuration manager to setting up ReportServer catalog database as well as confirm the web portal and web service URLs.

Step 4: To get the Power BI Web portal Go to Browser > Write > http://localhost/reports

Power BI reports on premises can store in Power BI reports Server or Power BI service (https://powerbi.com). You create and edit reports in Power BI Desktop, and publish them to the web portal. It can view able from browser or in a Power BI mobile app on a mobile device.
Power BI reports for Power BI Report Server:
Power BI Desktop optimized is required for Power BI Report Server. It’s important to remember that this one release is different from the Power BI Desktop used with the Power BI service.
Step 1: There is download link is in the Web portal.

Step 2: Now you have select the required installer .Installation steps are very easy.Main problem is that you have to careful on the version it should be October 2017.First time I’ve installed wrong version 😦 but Right one is “Optimized for Power BI Report Server – October 2017”.Download link has give on download section of above of present article.
It’s will better for new one to go through the article :
“User handbook overview for Power BI Report Server”
Hopefully this article objective is to help professionals. Have a nice day !